IoT Security Statistics [2026]: Threats & Trends

820,000 IoT cyberattacks happen every day — and 98% of all IoT device traffic crosses the network unencrypted (Palo Alto Networks). With 21.1 billion connected devices already active and 29.7 billion projected by 2027, the attack surface is growing faster than defences can scale. If you need the latest IoT security statistics to assess your connected device risk, justify an IoT security budget, or understand where the threats are concentrating, you're in the right place.
You'll find 50+ statistics across 10 sections — from medical device vulnerabilities to industrial IoT threats to smart home risks — sourced from Zscaler, Dragos, Forescout, Palo Alto Networks, Bitdefender, and 20+ authoritative reports. Each section includes original analysis cross-referencing multiple sources to surface insights you won't find in any single report.
Key Takeaways
- IoT attacks surged 107% in H1 2024, with 820,000+ daily incidents now the norm
- 98% of IoT device traffic is unencrypted, exposing data across 21.1 billion active devices
- Routers account for 75%+ of all IoT attack incidents and 50%+ of critical vulnerabilities
- 99% of hospitals manage IoMT devices with known exploited vulnerabilities
- ICS vulnerability disclosures nearly doubled to 2,451 in 2025 (from 1,690 in 2024)
- The BadBox 2.0 botnet compromised 10 million+ consumer devices globally
- Energy sector IoT attacks surged 387% year-over-year
- The IoT security market is projected to grow from $28.67B to $80.3B by 2031
📊 Headline IoT Security Numbers
These are the numbers that define the IoT threat landscape in 2026. Every connected device — from hospital MRI scanners to home smart speakers — expands the attack surface. The data shows a sector where adoption massively outpaces security.
| Finding | Value | Source |
|---|---|---|
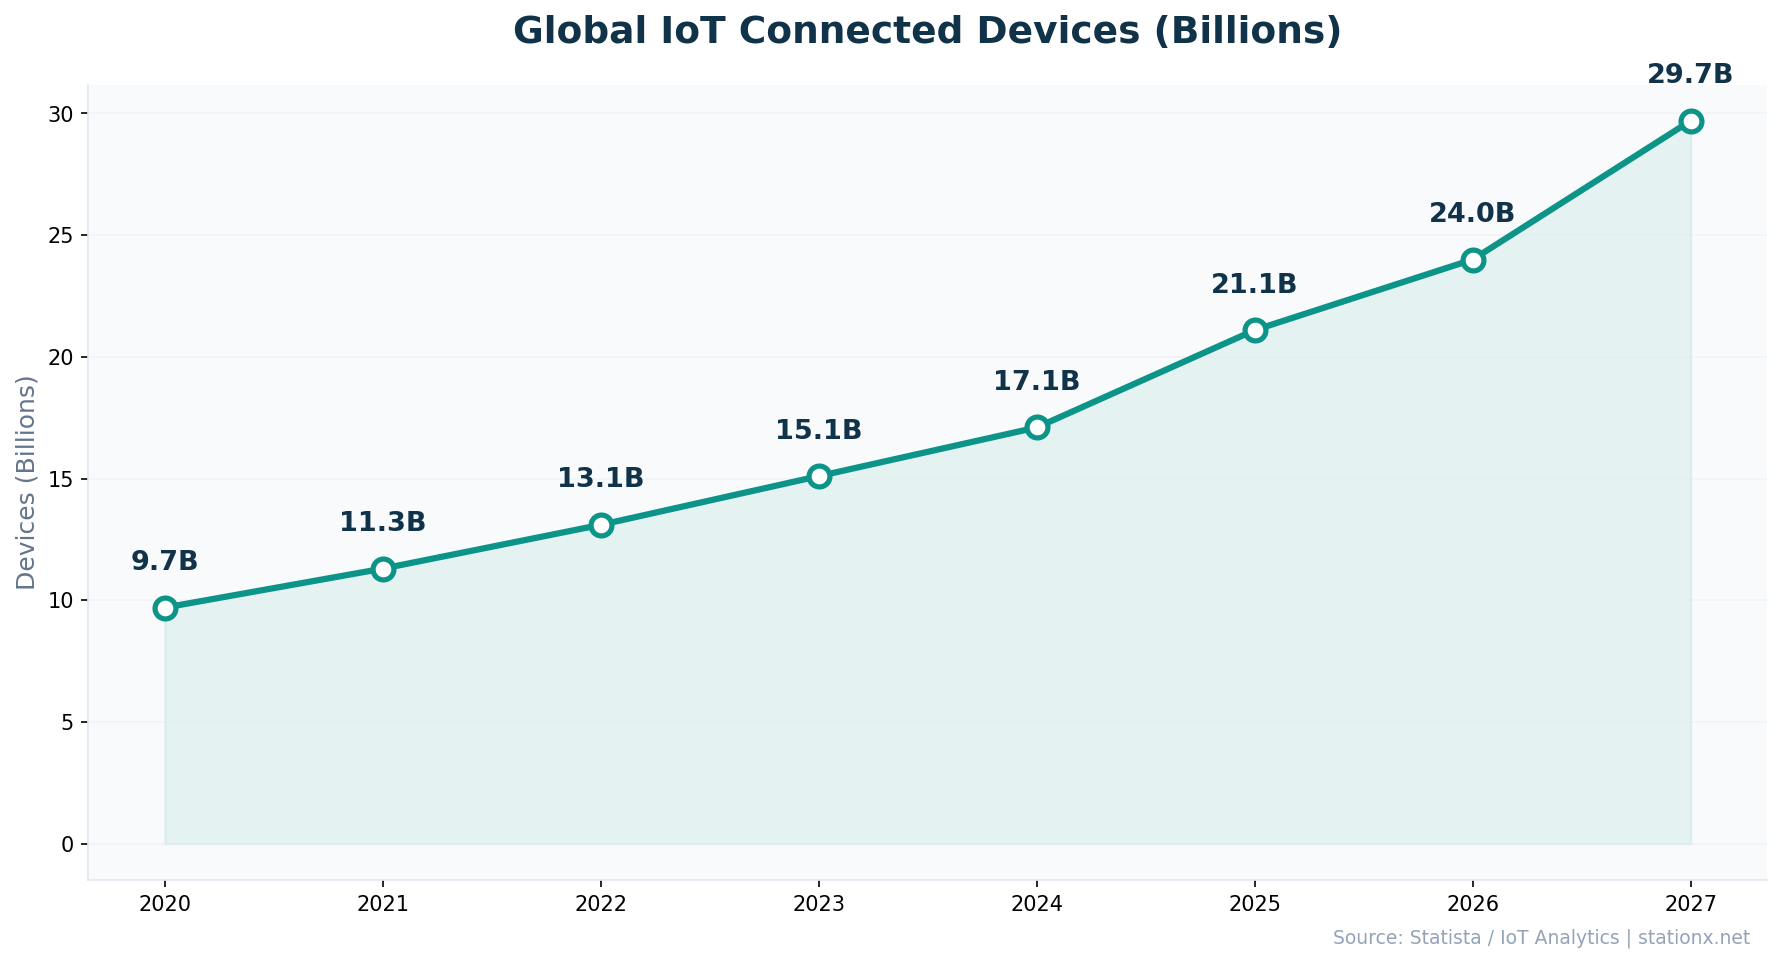
| IoT endpoints projected by 2027 | 29.7 billion | Statista |
| Active IoT devices worldwide (2025) | 21.1 billion | IoT Analytics |
| IoT device traffic that is unencrypted | 98% | Palo Alto Networks Unit 42 |
| Average daily IoT cyberattacks | 820,000+ | DeXpose / SentinelOne |
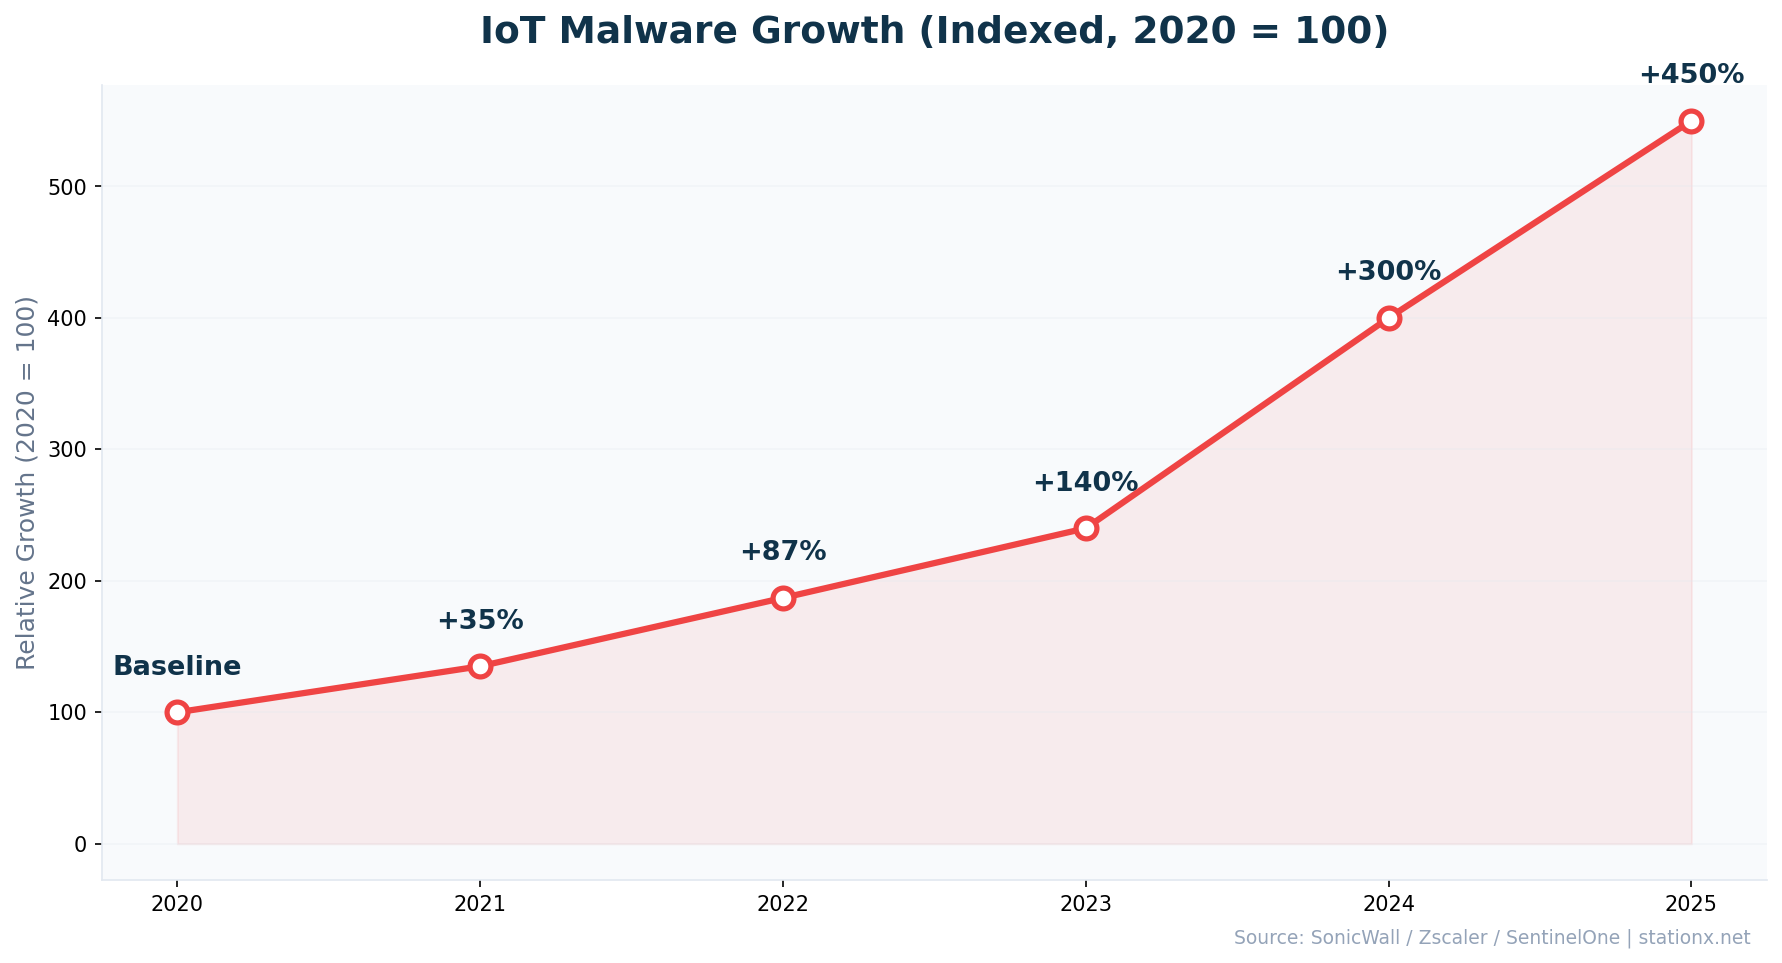
| IoT attack surge H1 2024 vs H1 2023 | 107% | SonicWall 2024 Mid-Year Cyber Threat Report |
| Surge in global IoT malware attacks | 124% | SentinelOne / Industry Reports |
| IoT devices vulnerable to attack | 70% | CybelAngel / HP |
| Ransomware using unmanaged devices | 90%+ | Microsoft Digital Defense Report 2024 |
Nathan House's Analysis: The Unencrypted Majority
Cross-referencing Palo Alto Networks' 98% unencrypted traffic finding with the 21.1 billion active devices: 98% unencrypted traffic across 21.1 billion devices means roughly 20.7 billion devices transmitting in plaintext. This isn't a misconfiguration — most IoT devices lack the processing power for TLS encryption, creating an architectural security gap that network segmentation must address.
📈 How Many IoT Devices Are There?
21.1 billion IoT devices were active worldwide in 2025, growing 14% year-over-year (IoT Analytics). By 2027, that number is projected to reach 29.7 billion — a 41% increase in just two years.
| Finding | Value | Source |
|---|---|---|
| Active IoT devices worldwide (2025) | 21.1 billion | IoT Analytics |
| Projected IoT endpoints by 2027 | 29.7 billion | Statista |
| Average IoT devices per US household | 21 | Security.org / Bitdefender |
The Household Attack Surface
The average US household now runs 21 IoT-connected devices — up from 15 just two years ago. That's 21 potential entry points per home, many running default credentials or outdated firmware. Multiply by 70 million smart-home households in the US alone, and you have 1.47 billion consumer IoT endpoints in American homes.
⚠️ IoT Attack Statistics
820,000+ IoT cyberattacks occur daily (SentinelOne), with attack volumes surging 107% in H1 2024 compared to the prior year (SonicWall). The energy sector bore the worst of it — a staggering 387% increase in IoT-targeted attacks.
| Finding | Value | Source |
|---|---|---|
| Average daily IoT cyberattacks | 820,000+ | DeXpose / SentinelOne |
| Attack surge H1 2024 vs H1 2023 | 107% | SonicWall 2024 Mid-Year Cyber Threat Report |
| Energy sector IoT attack increase YoY | 387% | Zscaler ThreatLabz 2025 IoT/OT Report |
| Manufacturing share of IoT malware attacks | 20.2% | Zscaler ThreatLabz 2025 IoT/OT Report |
| Healthcare IoT attack increase YoY | 224% | Zscaler ThreatLabz 2025 IoT/OT Report |
| Attacks targeting routers | 75%+ | Zscaler ThreatLabz 2025 IoT/OT Report |
| Ransomware reaching ransom stage via unmanaged devices | 90%+ | Microsoft Digital Defense Report 2024 |
| Smart home attack attempts per household daily | 29 | Bitdefender / Netgear 2025 IoT Security Report |
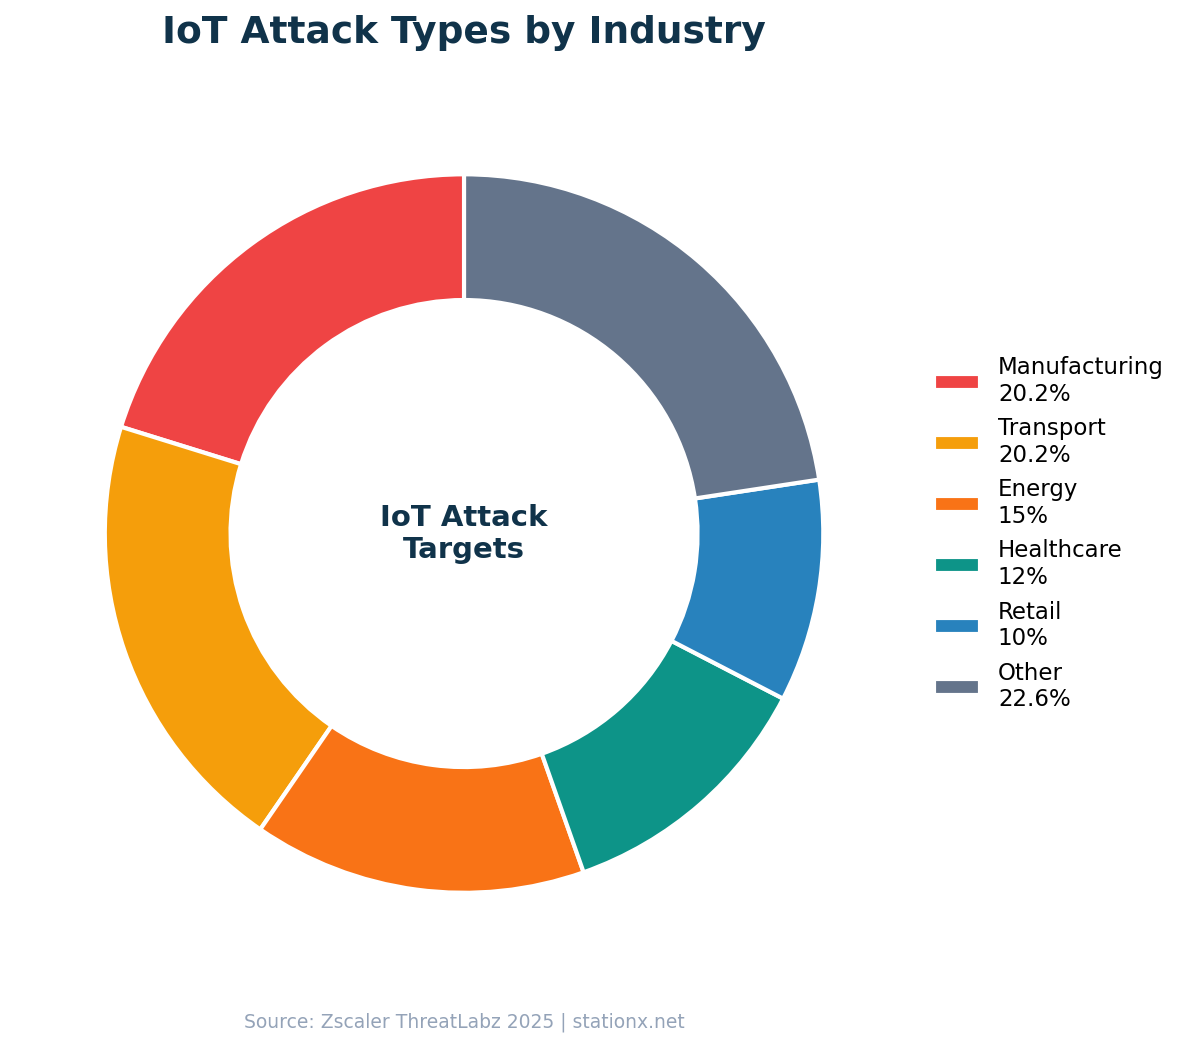
Most Targeted Sectors
- Energy: +387% attack increase YoY
- Transportation: +382% attack increase
- Healthcare: +224% attack increase
- Manufacturing: 20.2% of all IoT malware
Primary Attack Vectors
- Routers: 75%+ of all IoT incidents
- Default credentials exploitation
- Unpatched firmware vulnerabilities
- Lateral movement from unmanaged devices
Nathan House's Analysis: The Router Problem
Routers account for 75%+ of IoT attacks AND 50%+ of critical vulnerabilities. Zscaler and Forescout data converge on the same conclusion: routers are both the most attacked and most vulnerable IoT device class. They sit at the network perimeter, often run years-old firmware, and provide lateral movement to the entire internal network once compromised. Securing routers is the single highest-ROI IoT security action any organization can take.
🔓 IoT Vulnerabilities
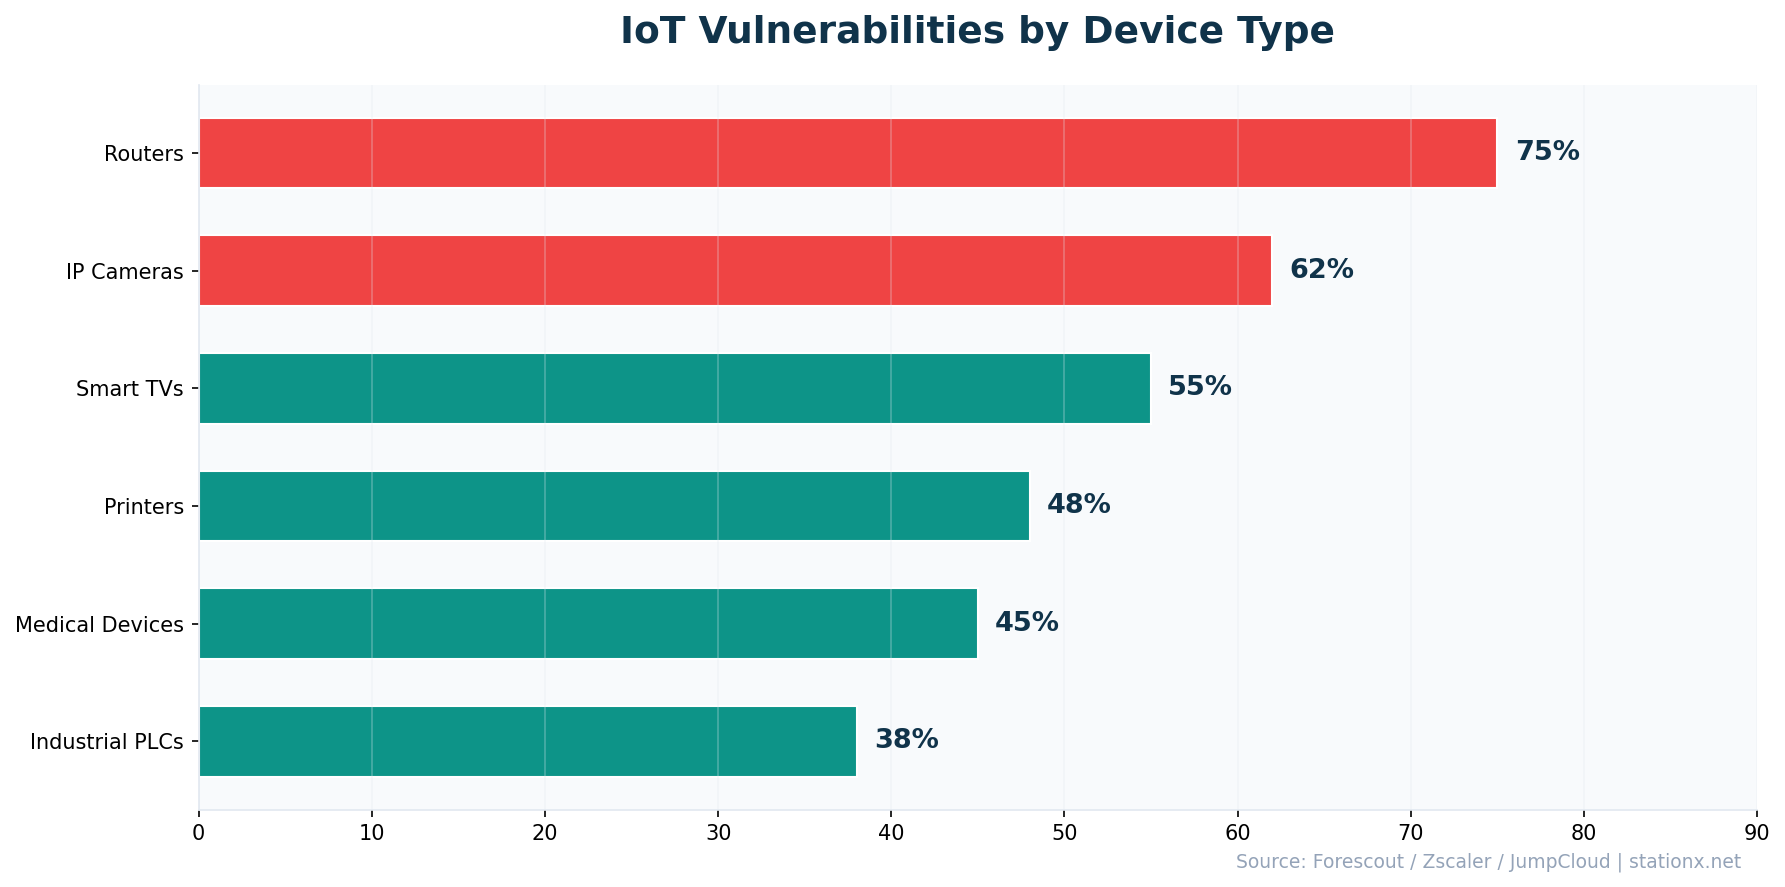
70% of IoT devices are vulnerable to medium or high-severity attacks (CybelAngel/HP). More than half have critical vulnerabilities that could be exploited immediately (JumpCloud). The root causes are structural: default credentials, missing update mechanisms, and hardcoded backdoors in firmware.
| Finding | Value | Source |
|---|---|---|
| IoT traffic unencrypted | 98% | Palo Alto Networks Unit 42 |
| Devices vulnerable to medium/high-severity attacks | 70% | CybelAngel / HP |
| Devices with critical vulnerabilities | 50%+ | JumpCloud |
| Routers as share of most critical vulnerabilities | 50%+ | Forescout Riskiest Connected Devices 2025 |
| Consumer IoT devices shipping with default credentials | 35% | SecureIoT / Industry Reports |
| IoT devices with no software update mechanism | 33% | SecureIoT / Industry Reports |
| Devices with hardcoded credentials in firmware | 17% | SecureIoT / Industry Reports |
The Permanent Backdoor Problem
17% of IoT devices contain credentials hardcoded directly in firmware that cannot be changed (SecureIoT). Combined with the 33% that have no software update mechanism at all, roughly half of consumer IoT devices are permanently insecure by design. No amount of network monitoring fixes a device that shipped with an immutable default password.
IoT Device Risk Explorer
Select a device category to see its risk profile based on the latest data.
Medical IoT devices carry the highest risk profile. 7.4 million IoMT devices are in operation, with 1.2 million exposed directly online. 89% of healthcare organizations use the most vulnerable IoT device categories.
🦠 IoT Malware & Botnet Statistics
IoT malware attacks surged 124% globally (SentinelOne). Three malware families — Mirai, Mozi, and Gafgyt — account for 75% of all malicious IoT payloads (Zscaler). The BadBox 2.0 botnet compromised over 10 million consumer devices including smart TVs and projectors.
| Finding | Value | Source |
|---|---|---|
| Surge in global IoT malware attacks | 124% | SentinelOne / Industry Reports |
| IoT payloads from Mirai, Mozi, Gafgyt families | 75% | Zscaler ThreatLabz 2025 IoT/OT Report |
| Devices compromised by BadBox 2.0 botnet | 10 million+ | Google / Trend Micro |
| Record Mirai botnet DDoS attack | 5.6 Tbps | Cloudflare |
| IoT attacks targeting routers | 75%+ | Zscaler ThreatLabz 2025 IoT/OT Report |
Nathan House's Analysis: The Botnet Scale Problem
The BadBox 2.0 botnet compromised 10 million+ consumer devices (Google/Trend Micro), while Cloudflare blocked a single Mirai-powered DDoS attack peaking at 5.6 Tbps. These two data points together illustrate why IoT botnets are a systemic risk: millions of compromised devices can be weaponised into attacks that exceed the capacity of most enterprise DDoS mitigation services.
Top IoT Malware Families
- Mirai: ~40% of payloads, record 5.6 Tbps DDoS
- Mozi: ~20%, P2P botnet resistant to takedown
- Gafgyt: ~15%, targets routers and cameras
Biggest Botnets (2025)
- BadBox 2.0: 10M+ compromised devices
- Aisuru: 300K+ devices, record DDoS
- Mirai variants: persistent, evolving
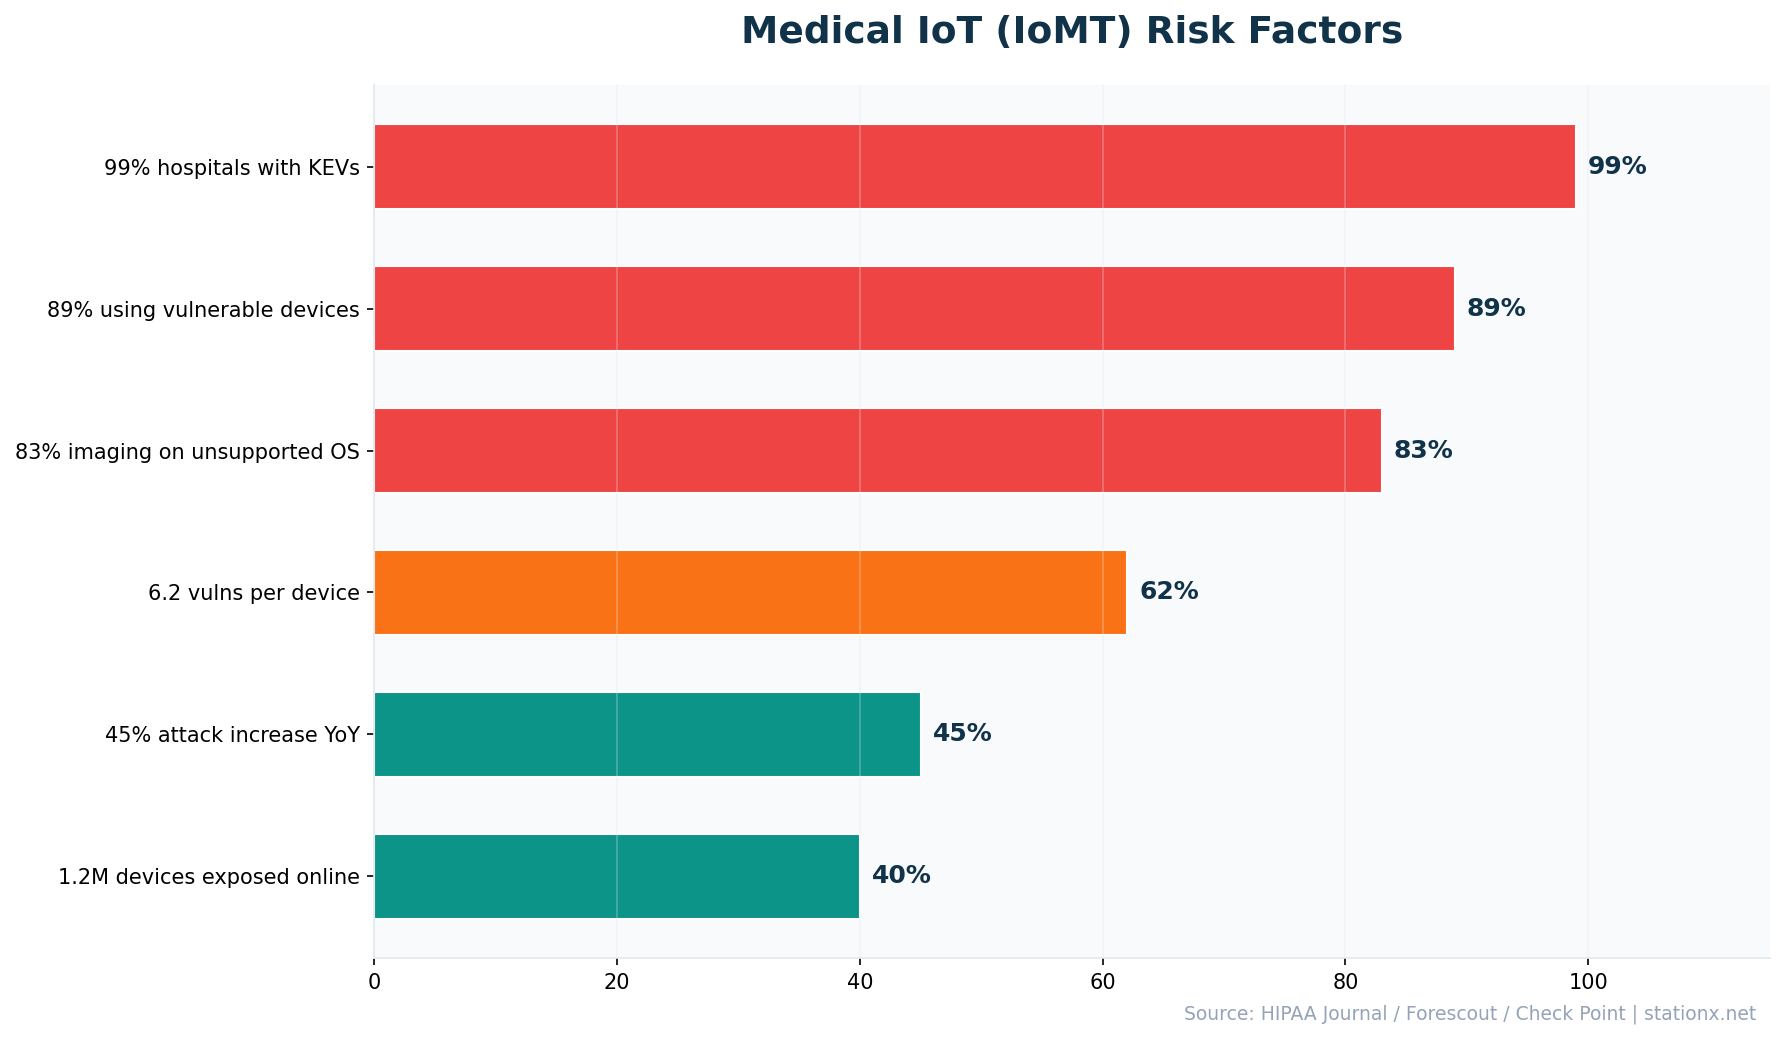
🏥 Medical Device Security
99% of hospitals manage IoMT devices with known exploited vulnerabilities (HIPAA Journal / Claroty). 83% of medical imaging devices run on unsupported operating systems. With 7.4 million IoMT devices in operation and 1.2 million directly exposed online, healthcare faces the highest IoT risk of any sector.
| Finding | Value | Source |
|---|---|---|
| Medical imaging devices on unsupported OS | 83% | SentinelOne / Industry Reports |
| Hospitals managing IoMT devices with KEVs | 99% | HIPAA Journal / Claroty |
| Hospitals with IoMT KEVs linked to ransomware | 96% | HIPAA Journal / Claroty |
| Internet of Medical Things devices | 7.4 million | SentinelOne / Industry Reports |
| IoT medical devices exposed online | 1.2 million | Device Authority |
| Healthcare orgs using most vulnerable IoT devices | 89% | Infosecurity Magazine / Cynerio |
| YoY increase in healthcare cyberattacks | 45% | Check Point Research |
| Average vulnerabilities per IoMT device | 6.2 | Forescout Riskiest Connected Devices 2025 |
| Healthcare IoT attack increase YoY | 224% | Zscaler ThreatLabz 2025 IoT/OT Report |
| Medical devices with known exploited vulnerabilities | 23% | Claroty State of CPS Security: Healthcare 2023 |
Nathan House's Analysis: Healthcare's Triple Vulnerability
Three independent sources converge on the same conclusion. HIPAA Journal reports 99% hospital KEV exposure. Infosecurity Magazine finds 89% of healthcare organizations use the most vulnerable IoT devices. Forescout calculates 6.2 vulnerabilities per IoMT device. Healthcare isn't just the most attacked sector (45% increase YoY per Check Point) — it's also the least equipped to defend, with 83% of imaging devices running end-of-life operating systems that cannot be patched.
Medical IoT Risk Factors
- 99% hospitals with known exploited vulns
- 96% of those KEVs linked to ransomware
- 83% imaging on unsupported OS
- 6.2 average vulnerabilities per device
Exposure Scale
- 7.4 million IoMT devices active
- 1.2 million exposed directly online
- 89% of healthcare orgs using riskiest devices
- 224% increase in healthcare IoT attacks
🏭 Industrial IoT & OT Security
Industrial IoT security faces its most challenging year yet. 2,451 ICS vulnerability disclosures were recorded in 2025 — nearly double the 1,690 in 2024 (Dragos). Ransomware attacks against OT systems surged 46% (Nozomi Networks), with 3,300+ industrial organizations impacted globally. Only 12.6% of organizations report full visibility across their ICS cyber kill chain.
| Finding | Value | Source |
|---|---|---|
| ICS vulnerability disclosures in 2025 | 2,451 | Dragos 2026 OT Cybersecurity Report |
| ICS-CERT vulnerabilities disclosed H2 2024 | 619 | Nozomi Networks OT/IoT Security Report 2025 |
| OT ransomware attack surge YoY | 46% | Nozomi Networks |
| Industrial organizations impacted by ransomware | 3,300+ | Dragos 2026 OT Cybersecurity Report |
| Organizations with full ICS Kill Chain visibility | 12.6% | SANS State of OT Security 2025 |
| Energy sector IoT attack increase | 387% | Zscaler ThreatLabz 2025 IoT/OT Report |
Nathan House's Analysis: The Visibility Gap in OT
Only 12.6% of organizations have full visibility across the ICS Cyber Kill Chain (SANS 2025). At Level 2 — supervisory control including SCADA and HMI systems — just 10% report full visibility. This means 87.4% of industrial organizations cannot detect an attack progressing from IT compromise to physical process manipulation. The 2,451 ICS vulnerability disclosures in 2025 are only useful if you can see when they're being exploited.
Industrial Risk Indicators
- 2,451 ICS vulnerability disclosures (2025)
- 46% OT ransomware surge (Nozomi)
- 3,300+ industrial orgs impacted
- 387% energy sector attack increase
Defence Gaps
- 12.6% with full ICS visibility
- 10% with Level 2 SCADA visibility
- 619 ICS-CERT vulns in H2 2024 alone
- HMIs most frequently targeted
🏠 Smart Home & Consumer IoT
29 smart home cyber attack attempts hit the average household every day (Bitdefender/Netgear). Smart device security remains a major concern as the average US household now runs 21 IoT-connected devices. 62% of those devices collect personally identifiable information, and 35% ship with default credentials still enabled.
| Finding | Value | Source |
|---|---|---|
| Smart home attack attempts per household daily | 29 | Bitdefender / Netgear 2025 IoT Security Report |
| Average IoT devices per US household | 21 | Security.org / Bitdefender |
| IoT devices collecting personally identifiable information | 62% | SecureIoT / Bitdefender |
| Consumer devices shipping with default credentials | 35% | SecureIoT / Industry Reports |
| Devices with no software update mechanism | 33% | SecureIoT / Industry Reports |
| Devices with hardcoded credentials in firmware | 17% | SecureIoT / Industry Reports |
Nathan House's Analysis: Consumer IoT Security by Design
The numbers reveal a fundamental market failure. 35% of consumer IoT devices ship with default credentials. 33% have no software update mechanism. 17% contain permanent firmware backdoors. That's roughly half of all consumer IoT devices that are insecure by design, not by misconfiguration. The EU Cyber Resilience Act and UK PSTI Act are the regulatory response — mandating security-by-design for all connected products sold in those markets.
IoT Security Readiness Quiz
Answer 8 questions to assess your organization's IoT security posture.
💰 IoT Security Market & Spending
The global IoT security market reached $28.67 billion in 2025 and is projected to grow to $80.3 billion by 2031 at a CAGR of 18.7% (MarketsandMarkets). Regulatory mandates, IT/OT convergence, and AI-driven detection are the primary growth drivers.
| Finding | Value | Source |
|---|---|---|
| Global IoT security market size (2025) | $28.67 billion | MarketsandMarkets |
| Projected IoT security market by 2031 | $80.3 billion | MarketsandMarkets |
Nathan House's Analysis: Spending vs Risk Gap
The IoT security market will nearly triple from $28.67B to $80.3B by 2031. That sounds positive until you compare it against the device growth trajectory: from 21.1B devices today to 29.7B by 2027. Security spending per device remains low. At current market size, global IoT security spending is approximately $1.36 per active device per year. Even at $80.3B by 2031, assuming 35B+ devices, that's roughly $2.30 per device.
IoT Attack Surface Calculator
Estimate your organization's IoT risk based on device count, types, and network segmentation.
⚖️ IoT Regulation & Standards
Two landmark regulations are reshaping IoT security requirements globally. The EU Cyber Resilience Act (CRA) carries fines up to €15 million or 2.5% of annual revenue, with mandatory vulnerability reporting starting September 2026 and full enforcement from December 2027. The UK PSTI Act is already in force, with penalties up to £10 million or 4% of revenue.
| Finding | Value | Source |
|---|---|---|
| EU Cyber Resilience Act maximum penalty | €15M or 2.5% revenue | European Commission |
| UK PSTI Act maximum penalty | £10M or 4% revenue | UK PSTI Act |
EU Cyber Resilience Act (CRA)
- In force: December 2024
- Vulnerability reporting: September 2026
- Full enforcement: December 2027
- Penalty: \u20AC15M or 2.5% revenue
- Scope: All IoT products sold in EU
UK PSTI Act
- Already in force (2024)
- Bans default passwords
- Requires vulnerability disclosure
- Penalty: \u00A310M or 4% revenue + \u00A320K/day
- Scope: All consumer-connected devices in UK
Nathan House's Analysis: Regulation as a Market Force
The EU CRA and UK PSTI Act represent the first serious regulatory pressure on IoT manufacturers. With 35% of devices still shipping with default credentials and 33% lacking update mechanisms, these weren't problems the market was going to solve voluntarily. The real test comes in September 2026 when CRA mandatory vulnerability reporting begins — manufacturers will need to disclose actively exploited vulnerabilities within 24 hours, fundamentally changing IoT security transparency.
🎯 Key Takeaways
- The scale is staggering. 21.1 billion IoT devices active today, 29.7 billion by 2027. 98% of their traffic is unencrypted. The attack surface is growing faster than defences.
- Routers are ground zero. 75%+ of all IoT attacks target routers, which also carry 50%+ of critical vulnerabilities. Securing network edge devices is the highest-ROI action.
- Healthcare is the most exposed sector. 99% of hospitals have IoMT devices with known exploited vulnerabilities. 83% of imaging devices run unsupported operating systems. 1.2 million medical devices are exposed online.
- Industrial IoT visibility is dangerously low. Only 12.6% of organizations have full ICS Kill Chain visibility, while ICS vulnerability disclosures nearly doubled to 2,451 in 2025.
- Consumer devices are insecure by design. 35% ship with default credentials, 33% have no update mechanism, and 17% contain permanent firmware backdoors.
- Regulation is catching up. The EU CRA and UK PSTI Act mandate security-by-design for all connected products, with penalties up to €15M / £10M for non-compliance.
- The market is responding. IoT security spending is projected to grow from $28.67B to $80.3B by 2031, but at ~$1.36 per device per year, the investment gap remains substantial.
❓ Frequently Asked Questions
How many IoT devices are there in 2026?
There are approximately 21.1 billion active IoT devices worldwide in 2025, growing 14% year-over-year (IoT Analytics). By 2027, that number is projected to reach 29.7 billion (Statista). The average US household now runs 21 connected devices.
What are the biggest IoT security threats?
The biggest IoT security threats are botnet malware (Mirai, Mozi, Gafgyt account for 75% of payloads), unpatched firmware vulnerabilities (70% of devices are vulnerable), default credential exploitation (35% ship with defaults), and DDoS attacks launched from compromised IoT fleets (record 5.6 Tbps attack recorded in 2024).
How many IoT attacks happen per day?
Over 820,000 IoT cyberattacks occur daily on average (SentinelOne/DeXpose). For smart home devices specifically, the average household faces 29 attack attempts per day (Bitdefender/Netgear 2025 report). IoT attack volumes surged 107% in H1 2024 compared to the prior year (SonicWall).
Are medical IoT devices secure?
Medical IoT devices are among the least secure. 99% of hospitals manage IoMT devices with known exploited vulnerabilities (HIPAA Journal). 83% of medical imaging devices run on unsupported operating systems. There are 7.4 million IoMT devices in operation, with 1.2 million exposed directly online. The average IoMT device has 6.2 known vulnerabilities (Forescout).
What IoT security regulations exist?
The two major IoT security regulations are the EU Cyber Resilience Act (CRA), which entered into force in December 2024 with full enforcement from December 2027 and fines up to €15M or 2.5% of revenue, and the UK Product Security and Telecommunications Infrastructure (PSTI) Act, already enforceable with penalties up to £10M or 4% of revenue. Both mandate security-by-design, ban default passwords, and require vulnerability disclosure for connected products.
About This Data
This article draws from 50 statistics aggregated from 20+ authoritative sources including Zscaler ThreatLabz, Dragos, Forescout, Palo Alto Networks Unit 42, Bitdefender, HIPAA Journal, Nozomi Networks, SonicWall, SentinelOne, Cloudflare, Check Point, JumpCloud, MarketsandMarkets, and SANS Institute.
Derived statistics (marked "Nathan House's Analysis") are computed by cross-referencing data from multiple sources — for example, comparing medical IoT risk data across HIPAA Journal, Forescout, and Infosecurity Magazine, or calculating per-device security spending from market size and device count data.
All statistics include inline source citations with links to primary sources. Data spans 2023–2026, with preference given to the most recent available figures. Last updated: June 2026.
How to Use This Data
Security professionals can use these statistics to build business cases for IoT segmentation investment, assess device risk across medical, industrial, and consumer categories, and quantify the regulatory exposure from the EU CRA and UK PSTI Act. The derived statistics and cross-referenced insights highlight patterns that individual vendor reports miss.
This page is updated monthly as new reports are published. Bookmark it and return for the latest data. If you spot an outdated statistic or want to suggest a source, contact us.
About the Author

Nathan House, Founder & CEO of StationX
Nathan House has 30 years of hands-on cybersecurity experience and is Cambridge-educated, holding CISSP, CISA, CISM, OSCP, CEH, and SABSA. He founded StationX in 1999 — one of the UK’s first cybersecurity companies — and has secured £71 billion in UK mobile banking transactions and the London 2012 Olympics, advising clients including Microsoft, Cisco, BP, Vodafone, and VISA. He authored the world’s most popular cybersecurity course — a #1 Udemy bestseller taken by over 500,000 students — and was named Cyber Security Educator of the Year 2020, AI Security Educator of the Year, and a UK Top 25 Security Influencer 2025. A DEF CON speaker and featured expert on CNN, Fox News, NBC, and the BBC, Nathan leads StationX’s training of more than half a million students worldwide.