Malware Statistics 2026:
55+ Facts on Threats & Trends

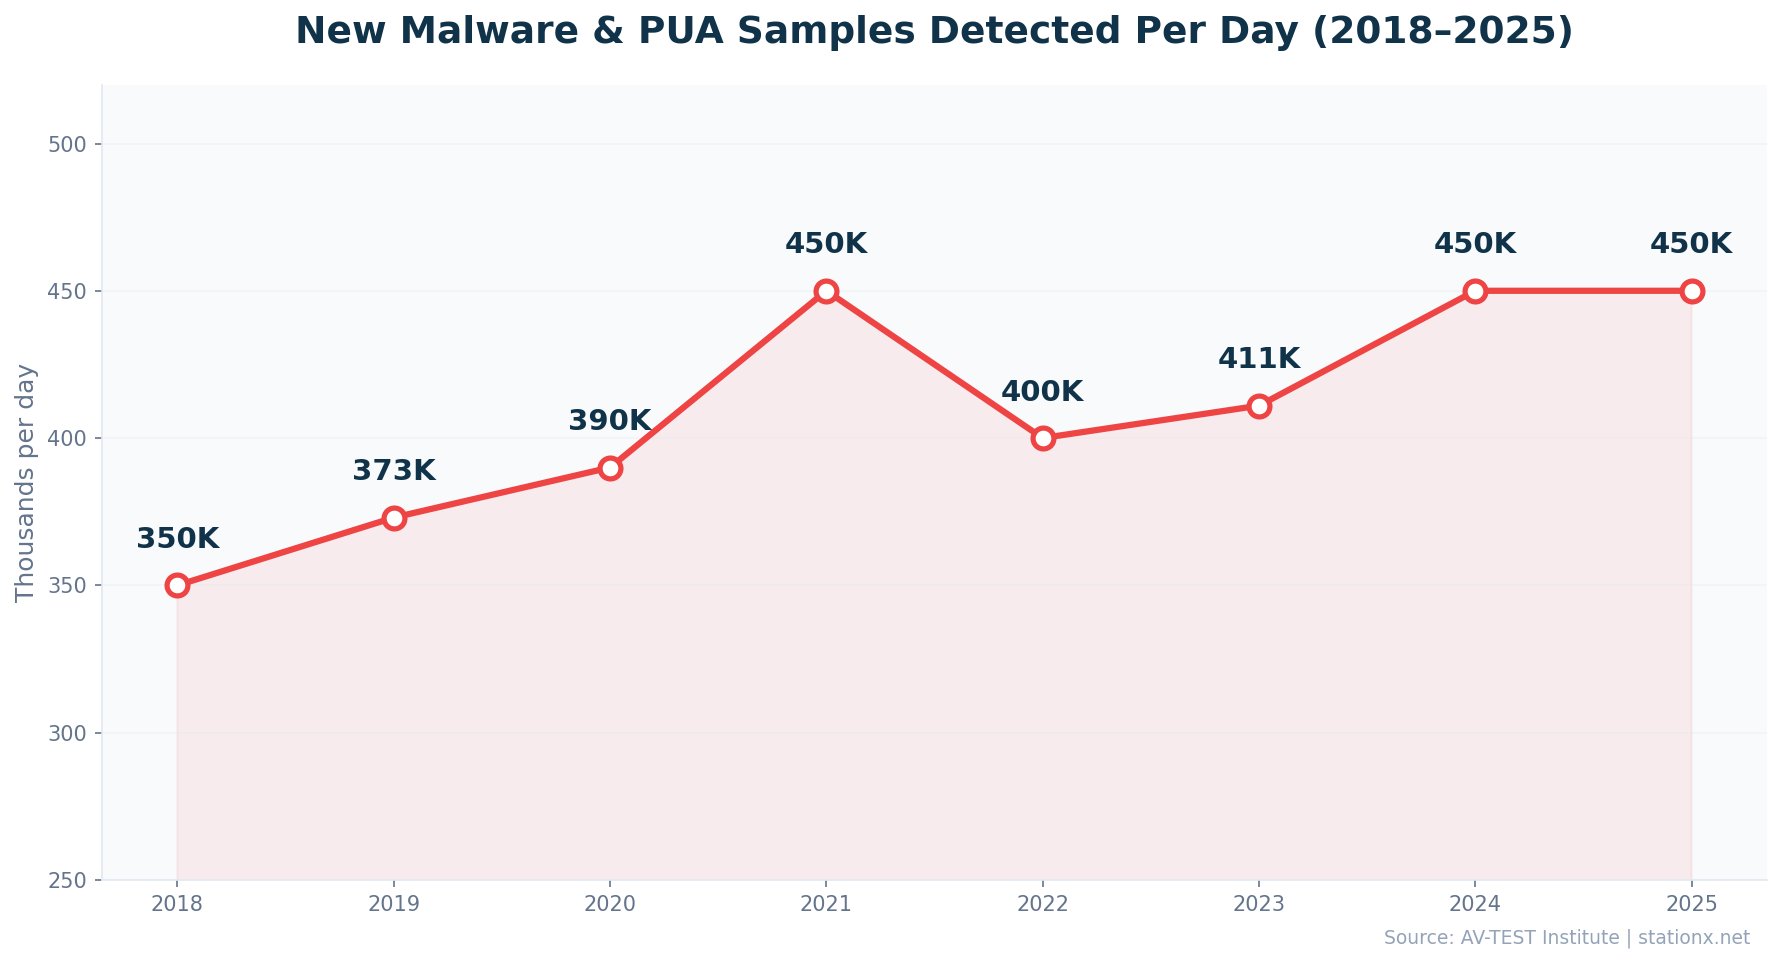
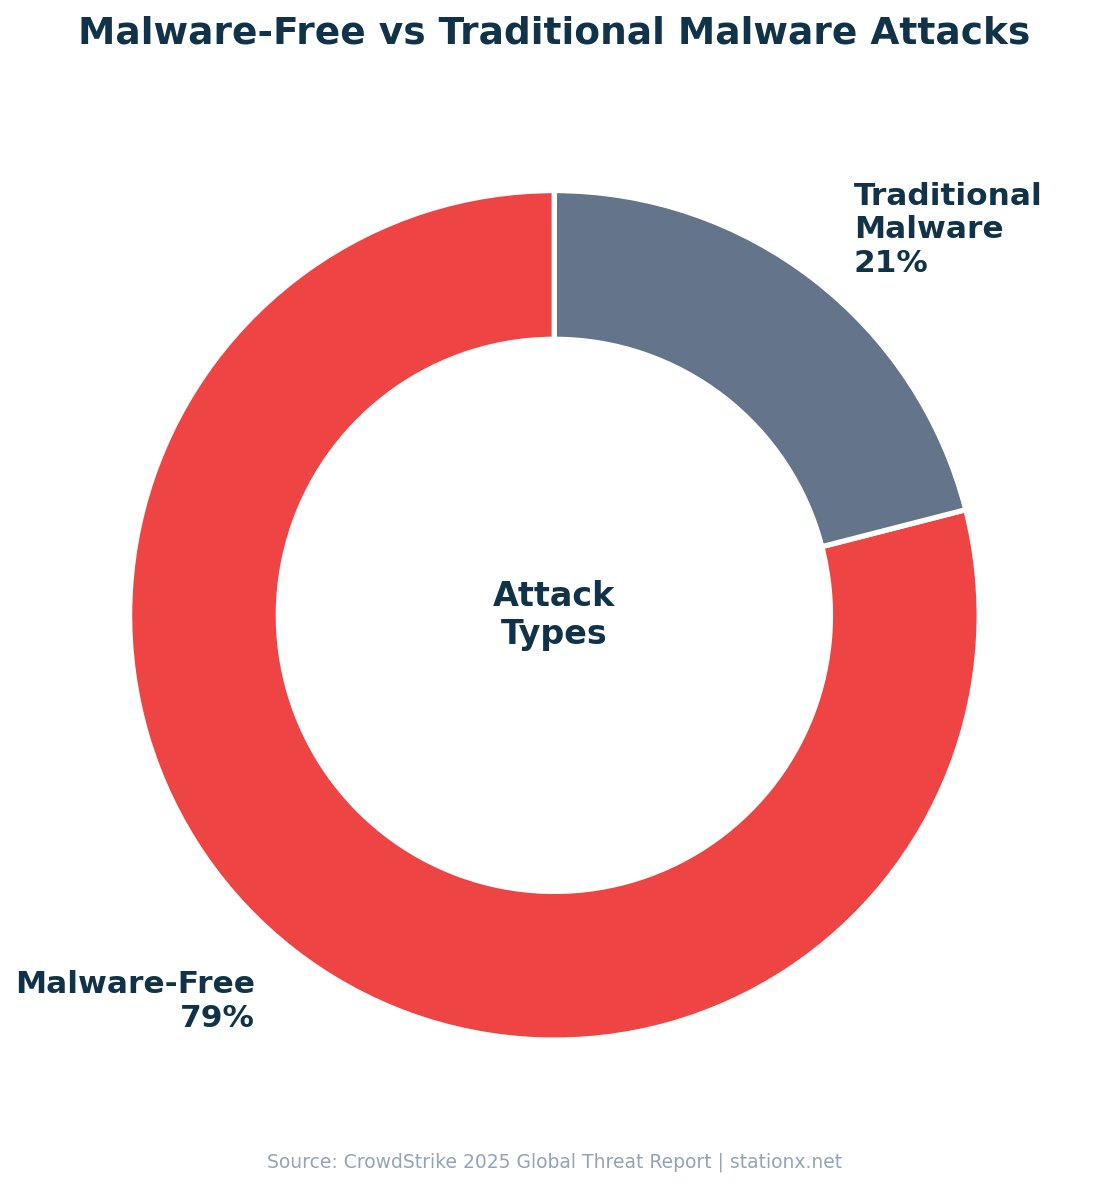
450,000 new malware samples appear every day (AV-TEST). That is 312 every minute, 5 every second, each one a fresh attempt to breach your defences. Yet 79% of attacks gaining initial access now use no malware at all (CrowdStrike 2025), relying instead on stolen credentials and living-off-the-land techniques.
Below you'll find 55+ statistics across 13 sections — covering volume trends, attack types, mobile threats, cryptojacking, delivery methods, and the growing shift to credential-based attacks. Sourced from AV-TEST, CrowdStrike, SonicWall, Kaspersky, IBM X-Force, and 20+ reports, with original cross-referenced analysis in every section.
Key Takeaways
- 450,000+ new malware and PUA samples are detected every day, totalling 1.56 billion known samples (AV-TEST).
- 79% of initial-access attacks are now malware-free, using stolen credentials and hands-on-keyboard techniques (CrowdStrike).
- Trojans dominate at 58% of all malware, while ransomware accounts for roughly 14%.
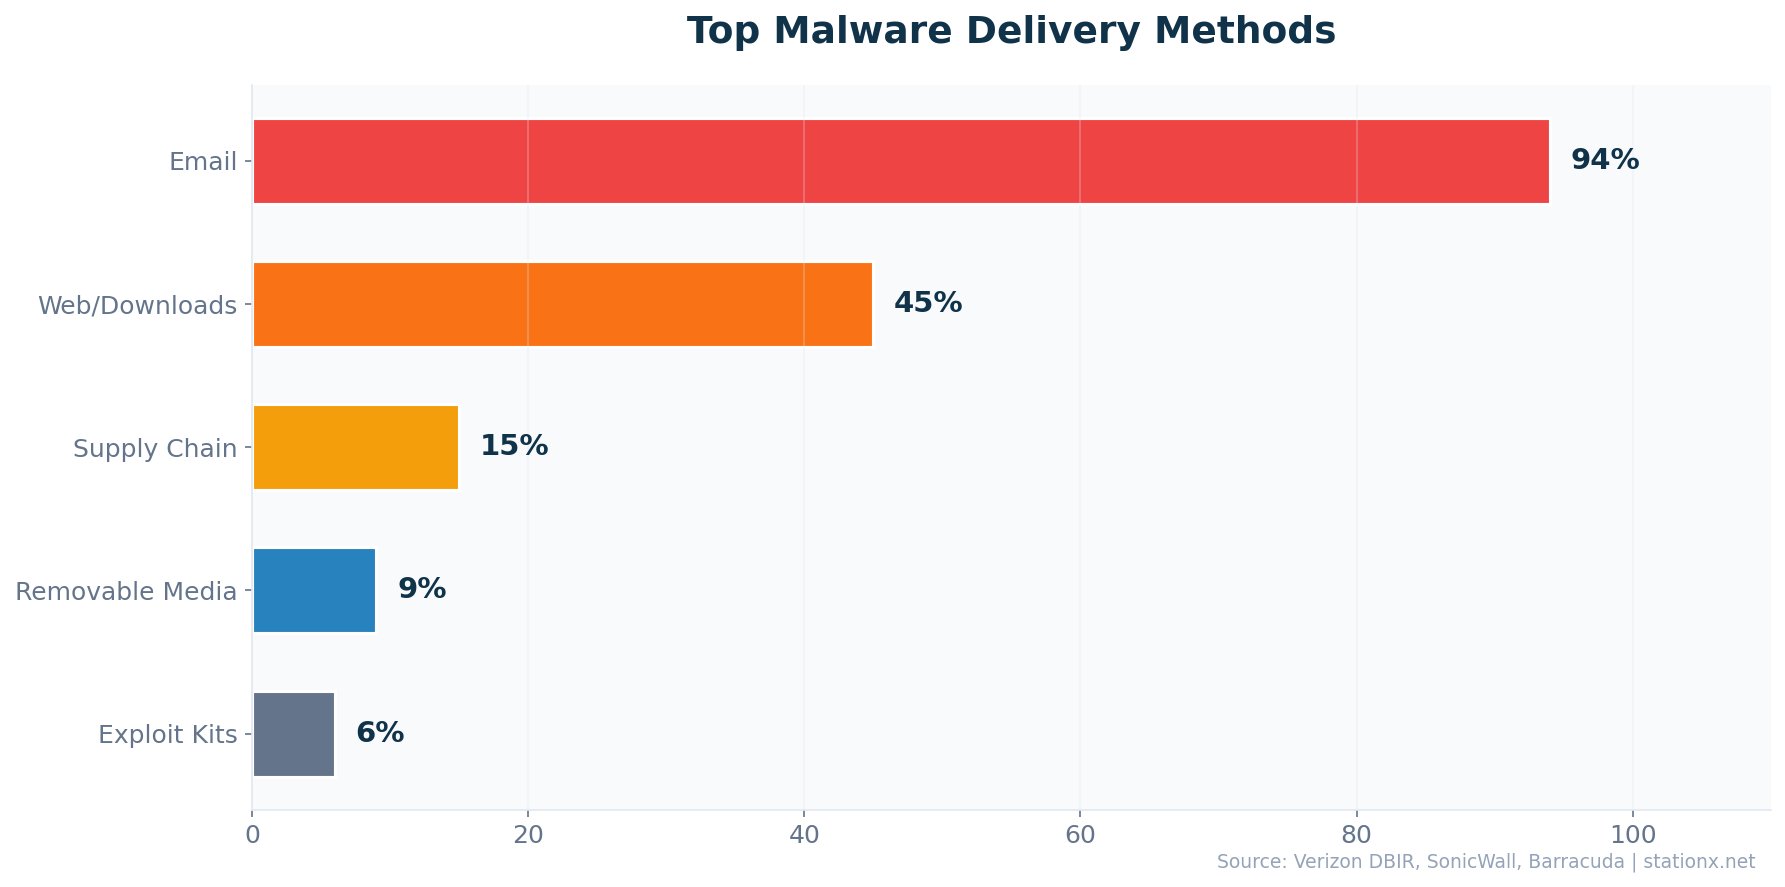
- 94% of malware is delivered via email, making it the overwhelming primary vector.
- 33.3 million mobile malware attacks were blocked in 2024. Banking trojans on smartphones surged 56% in 2025 (Kaspersky).
- 1.06 billion cryptojacking incidents recorded in 2023, a 659% increase (SonicWall).
- Manufacturing is the most-targeted sector at 27.7% of all incidents (IBM X-Force).
- The average ransomware attack costs $5.13 million, with downtime averaging 24 days.
- 76% of detected malware now shows AI-driven polymorphism, evading signature-based detection.
Last updated: June 2026
📊 Key Malware Numbers
AV-TEST registers hundreds of thousands of new malware and potentially unwanted programs every single day. The total library of known malware has surpassed 1.56 billion samples. Despite this relentless volume, the threat landscape is shifting: CrowdStrike reports that 79% of attacks gaining initial access no longer use malware at all, instead exploiting stolen credentials, access brokers, and living-off-the-land techniques.
SonicWall recorded an 8% year-over-year increase in overall malware volume in 2024, with a staggering 92% spike in May alone. Gen Digital blocks over 1 billion attacks per month across its consumer security products, a 46% increase from the prior year. 95% of those threats are web-based (Gen Digital Q2/2024).
| Finding | Value | Source |
|---|---|---|
| New malware and PUA detected daily | 450,000+ | AV-TEST Institute |
| Total known malware samples | 1.56 billion | AV-TEST Institute |
| Attacks that are malware-free | 79% | CrowdStrike 2025 Global Threat Report |
| Malware volume YoY increase | 8% | SonicWall 2025 Cyber Threat Report |
| Never-before-seen malware variants (2024) | 210,258 | SonicWall 2025 Cyber Threat Report |
| Attacks blocked monthly (Gen Digital) | 1 billion+ | Gen Q2/2024 Threat Report |
| Year-over-year attack increase | 46% | Gen Q2/2024 Threat Report |
| Malware delivered via email | 94% | Verizon DBIR / Cleartech Group |
| Trojans as share of all malware | 58% | AV-TEST Institute |
| Mobile malware attacks blocked (2024) | 33.3 million | Kaspersky Mobile Threat Report 2024 |
Scale of the Daily Threat
At that daily volume, that is 313 new malware programs every minute and 5 every second. Even top-tier antivirus with 99.95% detection rates (AV-Comparatives) would miss approximately 225 novel variants daily. This is why behavioural detection, EDR, and zero-trust architecture matter more than signature matching alone.
How common is malware? The sheer volume answers the question. With over 1 billion attacks blocked monthly by Gen Digital alone and hundreds of thousands of new samples appearing daily, malware is the most prevalent digital threat globally. The AV-TEST database contains 1.56 billion unique samples accumulated over decades. The trend is consistently upward, with only brief dips in specific years before returning to new highs.
New Malware Daily: The Scale Problem
The volume of new malware daily puts immense pressure on security teams. Each of the hundreds of thousands of new samples must be analysed, classified, and signatures distributed globally. Automated analysis pipelines process the bulk, but novel variants -- the never-before-seen samples SonicWall tracks each year -- require behavioural analysis and sandboxing. This is where malware detection gaps emerge: the time between a novel variant's first deployment and its inclusion in threat intelligence feeds can range from hours to days.
The data confirms what analysts have seen building over several years: raw volume growth is slowing (8% YoY), but sophistication is accelerating. Attackers invest in quality over quantity, with polymorphic and AI-generated variants that evade detection more effectively than mass-produced commodity malware. SonicWall's data on exploiting vulnerabilities within 2 days of disclosure (61% of the time) further confirms that speed and evasion now matter more than sheer numbers.
📈 Malware Volume & Growth Trends
Malware volume has grown steadily over the past decade. AV-TEST tracked a peak in daily detections around 2021, a brief dip in 2022, and a return to those elevated levels by 2024-2025. The total malware library has swelled from under 1 billion to 1.56 billion known samples.
SonicWall's 2025 Cyber Threat Report documented over 210,000 never-before-seen malware variants in 2024 alone. These are entirely new, previously undetected threats that bypass signature-based defences on first contact. The overall 8% year-over-year increase masks significant monthly spikes, with May 2024 seeing a 92% surge in malware volume.
| Finding | Value | Source |
|---|---|---|
| New malware and PUA detected daily | 450,000+ | AV-TEST Institute |
| Total known malware samples | 1.56 billion | AV-TEST Institute |
| Never-before-seen malware variants detected | 210,258 | SonicWall 2025 Cyber Threat Report |
| Malware volume YoY increase | 8% | SonicWall 2025 Cyber Threat Report |
| Malware spike in May 2024 alone | 92% | SonicWall 2025 Cyber Threat Report |
| Attacks blocked monthly (Gen Digital) | 1 billion+ | Gen Q2/2024 Threat Report |
| Year-over-year attack increase | 46% | Gen Q2/2024 Threat Report |
| Threats that are web-based (Gen Digital) | 95% | Gen Q2/2024 Threat Report |
Volume vs Sophistication: A Dual Problem
The raw volume of hundreds of thousands of daily samples is one challenge. The sophistication is another. SonicWall's annual count of never-before-seen variants represents malware that has never appeared in any threat intelligence feed. Cross-referencing with CrowdStrike's data showing 79% of attacks are now malware-free, we see a diverging threat landscape: mass-produced commodity malware floods the low end, while sophisticated attackers bypass malware entirely. Defenders must address both.
The historical pattern tells a clear story. From roughly 350,000 new daily samples in 2018, the volume rose to a peak around 2021 before briefly dipping in 2022 when many commodity malware families temporarily reduced output. By 2024, volumes returned to pre-dip levels and remain elevated. The compound annual growth in total known samples means the malware library roughly doubles every 4-5 years.
The May 2024 spike of 92% deserves attention. SonicWall attributes seasonal spikes to coordinated campaign launches, where multiple threat groups simultaneously deploy new variants to overwhelm detection systems. The 46% year-over-year increase in attacks blocked by Gen Digital further confirms this accelerating trend. 95% of these threats are web-based, meaning browser security and DNS filtering are increasingly critical layers.
Why Monthly Spikes Matter More Than Annual Averages
An 8% annual increase sounds manageable. But the 92% spike in May 2024 shows the real risk: attackers launch coordinated campaigns that can overwhelm detection capacity in specific months. Security teams planning capacity based on annual averages will be caught short during peak months. Budget for surge capacity, not average load.
Malware Statistics 2026: Year in Context
The numbers reveal several important shifts from previous years. While the daily new-sample volume remains at record levels, the composition has changed. More malware is polymorphic (76% now uses AI-driven code mutation), more is delivered through encrypted channels (45% via SSL/TLS), and more targets mobile platforms (banking trojans up 56%). The overall 8% year-over-year increase in volume reported by SonicWall understates the qualitative change: today's malware is harder to detect, faster to deploy, and more targeted than the mass-produced variants of previous years.
At the same time, the malware-free attack trend continues to accelerate. CrowdStrike's 79% figure for malware-free initial access is up from approximately 71% in 2022 and 51% in 2019. This 28-percentage-point shift in six years represents a fundamental change in how adversaries operate. Traditional antivirus and malware detection remain necessary but insufficient. The modern threat landscape demands identity security, behavioural analytics, and zero-trust architecture alongside endpoint protection.
AV-TEST Historical Data: The Long View
AV-TEST Institute has been tracking malware samples since 2000. In 2004, there were approximately 100,000 known malware samples total. By 2010, that number exceeded 50 million. By 2015, it passed 500 million. Today, at 1.56 billion, the total malware library has grown more than 15,000x in two decades. The growth rate has slowed in percentage terms, but the absolute numbers continue to climb: the library added roughly 150-200 million new samples per year in recent years.
This exponential growth reflects the industrialisation of malware development. Ransomware-as-a-service (RaaS) platforms, automated exploit kits, and now AI-powered code generation have dramatically lowered the barrier to creating new malware. A threat actor with basic technical skills can purchase a RaaS kit, generate unique variants using AI polymorphism, and launch campaigns targeting thousands of organisations, all within hours.
The web-based threat landscape has also evolved significantly. Gen Digital reports that 95% of consumer-facing threats are now web-based rather than file-based. This means malware increasingly executes in the browser context through malicious JavaScript, compromised advertising networks, and drive-by downloads from legitimate but compromised websites. Traditional endpoint detection that focuses on file scanning misses these browser-based threats entirely.
The Industrialisation of Malware
The combination of RaaS platforms, AI polymorphism, and access broker marketplaces has created an industrial malware supply chain. Criminals can now specialise: one group gains access (access brokers), another develops the malware (RaaS operators), another launders payments (crypto mixers). This specialisation mirrors legitimate business operations and has dramatically increased the volume, quality, and targeting precision of attacks.
🧩 Types of Malware Breakdown
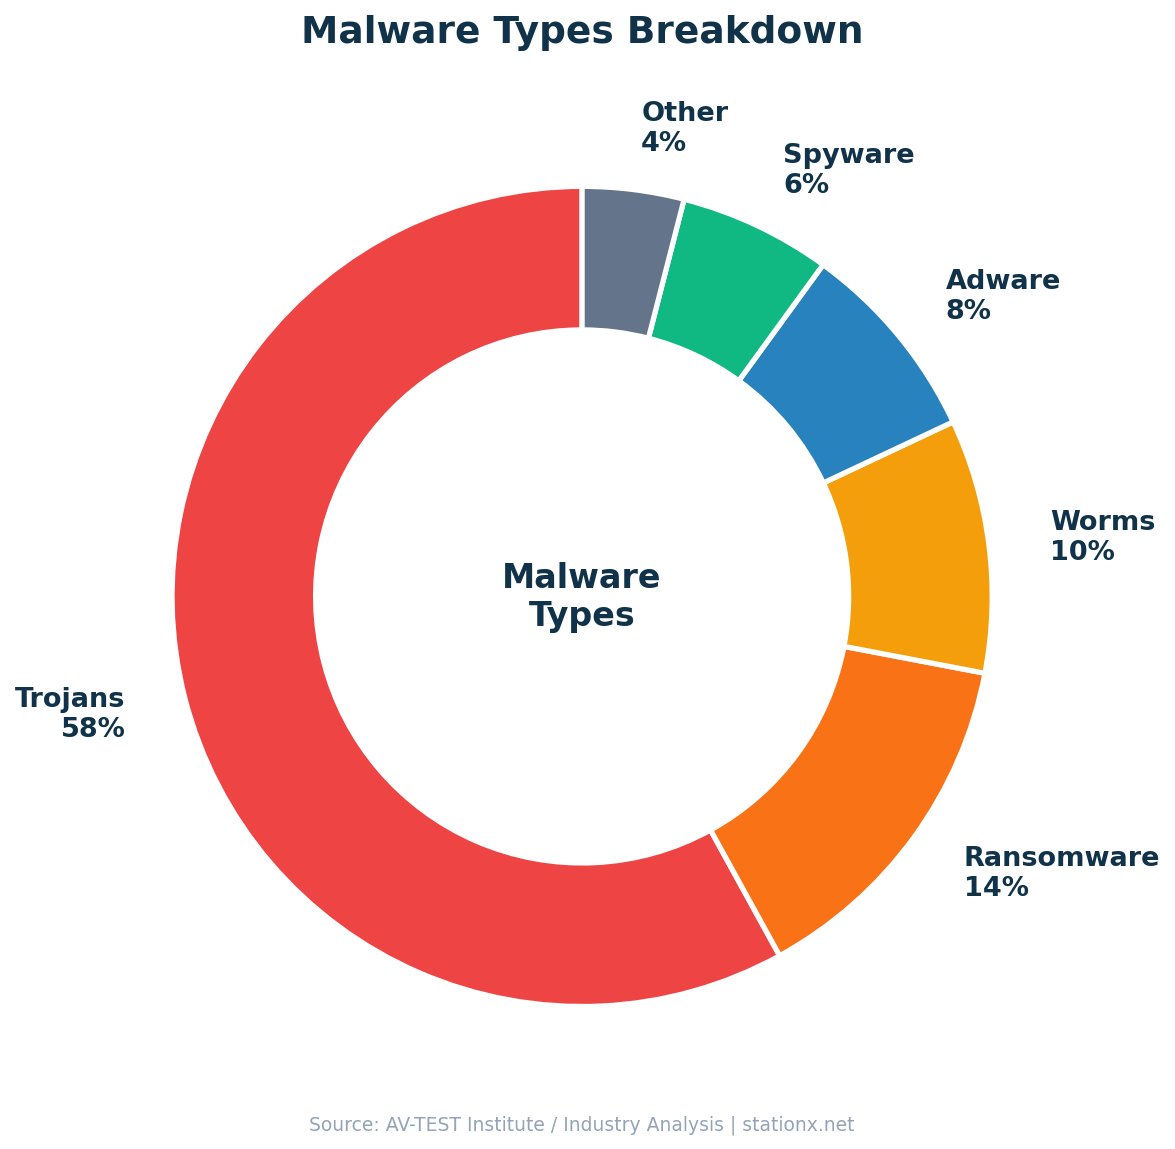
Trojans are the dominant malware type at 58% of all detections (AV-TEST). They disguise themselves as legitimate software to gain access, then deliver payloads ranging from data theft to ransomware deployment. Ransomware accounts for roughly 14% of malware but causes disproportionate financial damage due to its extortion model.
Worms (10%) spread autonomously through networks without user interaction, while adware (8%) generates revenue by injecting unwanted advertisements. Spyware (6%) silently harvests credentials, keystrokes, and browsing data. Cryptominers and other specialised malware make up the remaining 4%. On mobile devices, the mix shifts dramatically: adware accounts for 62% of all mobile malware detections (Kaspersky 2025).
| Finding | Value | Source |
|---|---|---|
| Trojans as share of all malware | 58% | AV-TEST Institute |
| Increase in lookalike domain attacks | 1,265% | Darktrace End-to-End Security Report 2024 |
| Never-before-seen malware variants | 210,258 | SonicWall 2025 Cyber Threat Report |
| Cryptojacking hits (2023) | 1.06 billion | SonicWall 2024 Cyber Threat Report |
| Adware share of mobile malware | 62% | Kaspersky Mobile Threat Report 2025 |
Malware Type Explorer
Select a malware type to see its key characteristics and threat data.
Trojans vs Ransomware: Volume vs Damage
Trojans outnumber ransomware roughly 4-to-1 in detection volume (58% vs 14%), but ransomware causes wildly disproportionate financial damage. A single ransomware attack averages millions of dollars in total costs and weeks of downtime. By contrast, most trojans serve as delivery vehicles for other payloads, including ransomware itself. Defending against trojans upstream is defending against ransomware downstream.
Ransomware vs Malware: Understanding the Difference
Ransomware is a subset of malware, not a separate category. All ransomware is malware, but most malware is not ransomware. Ransomware specifically encrypts victim data and demands payment for the decryption key. When comparing ransomware vs malware, think of malware as the umbrella term covering trojans, worms, adware, spyware, ransomware, and cryptominers. The distinction matters because malware detection tools must handle all types, while ransomware-specific defences focus on encryption behaviour, backup integrity, and payment prevention.
The prevalence of each malware type varies by platform. On desktop, trojans dominate. On mobile devices, adware accounts for 62% of detections (Kaspersky 2025), with banking trojans the fastest-growing category at 56% year-over-year increase. In industrial environments, ransomware targeting ICS systems increased 20% (Kaspersky ICS CERT), reflecting the expanding attack surface as operational technology connects to IT networks.
Lookalike domain attacks, a specialised trojan delivery mechanism, increased by 1,265% (Darktrace). These attacks register domains nearly identical to legitimate ones, tricking users into downloading trojanised software. Darktrace's data shows this technique is particularly effective against organisations without DNS filtering or domain monitoring.
Emerging Malware Types to Watch
Several emerging malware types are reshaping the threat landscape. Fileless malware operates entirely in memory, leaving no files on disk for traditional antivirus to scan. It uses legitimate system tools like PowerShell, WMI, and rundll32 to execute malicious operations, making it invisible to file-based detection. CrowdStrike's 79% malware-free statistic partly reflects the adoption of fileless techniques.
Infostealers are another rapidly growing category. Malware families like Lumma, RedLine, and Vidar specialise in harvesting credentials, browser cookies, cryptocurrency wallet data, and session tokens from infected machines. These stolen credentials feed directly into the access broker marketplace, creating a pipeline from commodity infostealer infections to targeted enterprise breaches.
Wiper malware, designed purely to destroy data without any ransom demand, has appeared in geopolitically motivated attacks. Unlike ransomware, wipers have no recovery mechanism; the destruction is permanent. First deployed heavily in the Russia-Ukraine conflict, wiper malware has since appeared in attacks against critical infrastructure in other regions. For organisations facing nation-state threat actors, wiper defence (primarily air-gapped, tested backups) is essential.
The Infostealer Pipeline
Infostealers like Lumma and RedLine cost as little as $200/month on criminal forums. They harvest credentials from thousands of machines, which are then sold on access broker markets. CrowdStrike's 50% increase in access broker ads is partly fuelled by infostealer output. This creates a malware-to-breach pipeline: commodity infections produce the credentials that enable targeted attacks. Blocking infostealers at the email and endpoint level disrupts the entire supply chain.
👻 Malware-Free Attacks — The Shift
79% of attacks to gain initial access are now malware-free (CrowdStrike 2025). Adversaries exploit compromised credentials to log in as legitimate users, then move laterally with hands-on-keyboard techniques. Access broker advertisements surged 50% year-over-year, fuelling a marketplace where stolen credentials are sold to the highest bidder.
Interactive intrusion campaigns, where attackers manually operate within compromised environments, increased 35% year-over-year. The average eCrime breakout time dropped to 48 minutes, with the fastest recorded at just 51 seconds. This means defenders have under an hour to detect and contain an intrusion before it spreads.
| Finding | Value | Source |
|---|---|---|
| Attacks that are malware-free | 79% | CrowdStrike 2025 Global Threat Report |
| Access broker advertisements increase YoY | 50% | CrowdStrike 2025 Global Threat Report |
| Interactive intrusion campaign increase YoY | 35% | CrowdStrike 2025 Global Threat Report |
| Average eCrime breakout time | 48 minutes | CrowdStrike 2025 Global Threat Report |
| Fastest recorded breakout time | 51 seconds | CrowdStrike 2025 Global Threat Report |
Malware-Free Techniques
- Stolen credential abuse (identity attacks)
- Living-off-the-land binaries (LOLBins)
- Access broker marketplace purchases
- Hands-on-keyboard intrusions
- Social engineering and vishing (+442%)
Traditional Malware (21%)
- Trojans and droppers
- Ransomware payloads
- Worms and self-propagating threats
- Keyloggers and spyware
- Cryptominers
The Identity-First Attack Surface
Cross-referencing CrowdStrike and IBM data reveals a clear pattern: the attack surface has shifted from software to identity. CrowdStrike shows 79% of initial access is malware-free. IBM reports stolen credentials are the costliest breach vector at $4.81M per incident. Access broker ads are up 50%. Vishing surged 442%. The implication: organisations spending primarily on antivirus and endpoint protection without investing in identity security, MFA, and credential monitoring are defending the wrong perimeter.
The Access Broker Economy
Access broker advertisements on criminal forums surged 50% year-over-year (CrowdStrike 2025). These brokers specialise in gaining initial access to corporate networks, then selling that access to ransomware operators, data thieves, or espionage actors. The average listing price ranges from a few hundred dollars for small businesses to tens of thousands for large enterprises or government networks.
The fastest recorded eCrime breakout time of just 51 seconds underscores the automation driving these attacks. Once credentials are purchased from a broker, the attacker logs in as a legitimate user, escalates privileges, and begins lateral movement within seconds. CrowdStrike tracked seven new China-nexus adversaries in 2024 alone, fuelling a 150% surge in espionage operations. Critical industries saw up to a 300% spike in targeted attacks.
The 79% malware-free figure does not mean malware is irrelevant. Traditional malware still accounts for 21% of initial access, and once inside, attackers frequently deploy malware payloads for persistence, data exfiltration, or ransomware deployment. The shift to malware-free initial access simply means the front door is now identity, not software exploits.
Living Off the Land: How Malware-Free Attacks Work
Malware-free attacks exploit legitimate system tools already present on every Windows machine. PowerShell, Windows Management Instrumentation (WMI), PsExec, and built-in administration tools are used to execute malicious operations without dropping any custom malware files. Security tools that focus on scanning files miss these attacks entirely because no malicious files exist to scan.
The typical malware-free attack chain starts with credential theft (phishing, infostealer, or purchase from an access broker), followed by legitimate authentication to the target network, then lateral movement using native tools. CrowdStrike's 35% increase in interactive intrusions reflects hands-on-keyboard activity where human operators manually navigate compromised networks using the same tools that IT administrators use daily.
Detecting malware-free attacks requires behavioural analytics rather than file scanning. User and Entity Behaviour Analytics (UEBA) establishes baselines for normal user activity and flags anomalies: a finance employee running PowerShell scripts at 3 AM, an HR account accessing engineering repositories, or a VPN connection from an unusual geography. These behavioural signals are the primary indicators for 79% of attacks that carry no malware signature.
Why Traditional AV Cannot Catch 79% of Modern Attacks
Traditional antivirus scans files for known malicious signatures. When 79% of attacks use no files and instead exploit legitimate tools and stolen credentials, signature-based AV is structurally incapable of detecting them. This does not make AV obsolete; it still catches the 21% of attacks that do use malware, plus commodity threats and mass campaigns. But AV alone leaves 79% of initial access attempts undetected. EDR, UEBA, and identity security fill this gap.
📱 Mobile Malware Statistics
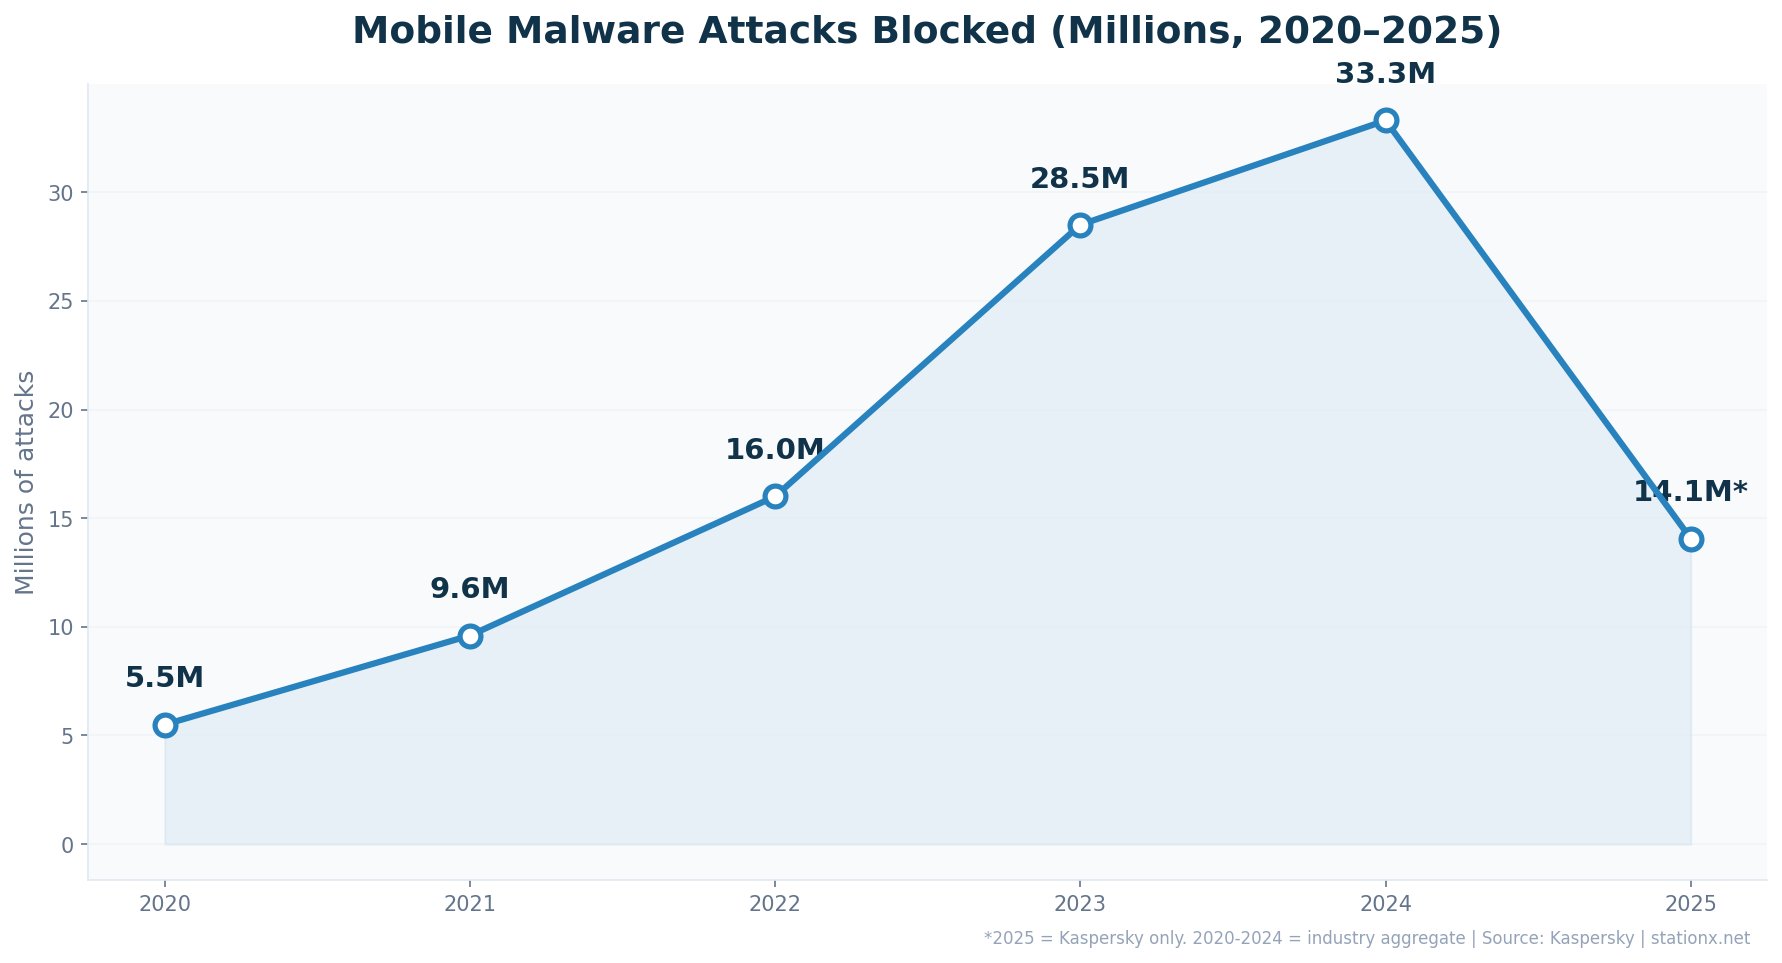
Kaspersky blocked 33.3 million mobile malware attacks in 2024. In 2025, the company blocked 14.06 million attacks across 1.17 million monthly average incidents. Banking trojans on smartphones surged 56% year-over-year in 2025, with 255,090 new banking trojan installation packages detected for Android, a 271% increase over 2024.
Adware remains the most prevalent mobile threat at 62% of all detections. The Mamont banking trojan accounted for 49.8% of mobile banking attacks. Attacks on Android users rose 29% in the first half of 2025 compared to the same period in 2024. Preinstalled backdoors such as Triada now appear on newly purchased Android devices, providing attackers with full device control before the user even opens the box.
| Finding | Value | Source |
|---|---|---|
| Mobile malware attacks blocked (2024) | 33.3 million | Kaspersky Mobile Threat Report 2024 |
| Mobile malware attacks blocked (2025) | 14.06M | Kaspersky Mobile Threat Report 2025 |
| Mobile banking trojan detections (2024) | 247,949 | Kaspersky Financial Cyberthreats Report 2024 |
| Banking trojan attacks increase YoY | 56% | Kaspersky Mobile Threat Report 2025 |
| New banking trojan packages (Android, 2025) | 255,090 | Kaspersky Mobile Threat Report 2025 |
| Android banking trojan installers (2024) | 1.24 million | Kaspersky Mobile Threat Report 2024 |
| Attacks on Android users increase (H1 2025 vs H1 2024) | 29% | Kaspersky Mobile Threat Report 2025 |
| Adware share of mobile malware | 62% | Kaspersky Mobile Threat Report 2025 |
| Mobile phishing sites optimised for mobile | 83% | Zimperium Mobile Threat Report 2024 |
| Workers using unsecured personal devices | 70% | Zimperium Mobile Threat Report 2024 |
| Workers performing risky actions on devices | 71% | Zimperium Mobile Threat Report 2024 |
| Mobile devices connecting to unsecured networks | 45% | Zimperium Mobile Threat Report 2024 |
| Attacks originating from endpoints | 90% | Zimperium Mobile Threat Report 2024 |
Banking Trojans: The Fastest-Growing Mobile Threat
Cross-referencing Kaspersky's 2024 and 2025 data reveals banking trojans are growing faster than any other mobile threat category. The 56% attack increase and 271% surge in new packages suggest criminal groups are industrialising mobile financial theft. Meanwhile, Zimperium reports 70% of workers use unsecured personal devices for work and 83% of phishing sites are now optimised for mobile. The convergence of BYOD and banking trojan growth creates a direct pipeline from personal device to corporate bank account.
The BYOD Security Gap
Zimperium data paints a concerning picture: 70% of workers use unsecured personal devices, 71% perform risky actions, and 45% connect to unsecured networks. When combined with Kaspersky's 33.3 million mobile attacks, the risk to enterprise data through employee personal devices is enormous. Organisations without mobile threat defence are effectively leaving a door unlocked.
Android vs iOS: The Security Divide
Android remains the primary target for mobile malware due to its open ecosystem and sideloading capabilities. Attacks on Android users rose 29% in H1 2025 compared to H1 2024 (Kaspersky). The 255,090 new banking trojan packages represent a 271% increase over 2024, indicating industrialised malware development targeting Android's banking application ecosystem.
iOS is not immune. Kaspersky researchers uncovered new spyware variants infiltrating the iOS ecosystem in 2025, including SparkKitty which affected both platforms by harvesting images from device galleries, particularly targeting cryptocurrency wallet recovery codes. Preinstalled backdoors such as Triada and Keenadu appeared on newly purchased Android devices, giving attackers full control before the user even configures the phone.
Android Threats
- 29% more attacks in H1 2025
- 255,090 new banking trojan packages
- 62% adware in mobile detections
- Preinstalled Triada backdoors
- Mamont trojan: 49.8% of banking attacks
iOS Threats
- New spyware variants discovered (2025)
- SparkKitty harvesting wallet recovery codes
- Phishing sites: 83% optimised for mobile
- Enterprise certificate abuse for sideloading
- Less volume but higher-value targets
Zimperium reports that 90% of attacks now originate from endpoints, and 83% of phishing sites are optimised for mobile viewing. This confirms a shift in attacker targeting: mobile is no longer a secondary concern but a primary attack surface. With 45% of mobile devices connecting to unsecured networks (Zimperium), the combination of network-level exposure and application-level threats creates a compounding risk for organisations that lack mobile threat defence.
Mobile Malware Defence Strategies
The mobile data makes a clear case for mobile threat defence (MTD) solutions. With 33.3 million attacks in 2024, a 56% surge in banking trojans, and 70% of workers using unsecured personal devices, the mobile attack surface demands the same level of protection as traditional endpoints. MTD solutions provide on-device threat detection, phishing URL filtering, network security assessment, and app vetting that enterprise MDM solutions typically lack.
For organisations implementing BYOD policies, the data points to three non-negotiable controls. First, mandatory mobile threat detection on any personal device accessing corporate resources. Second, conditional access policies that block devices connecting from unsecured networks or running outdated operating systems. Third, mobile-specific phishing protection, since 83% of phishing sites are now optimised for mobile viewing (Zimperium). Without these controls, the 70% of workers using unsecured personal devices represent a direct pathway from consumer-grade mobile malware to enterprise data.
The preinstalled malware threat identified by Kaspersky adds another dimension. Triada and Keenadu backdoors appearing on brand-new Android devices mean that even a freshly unboxed phone may already be compromised. Organisations providing corporate devices should source from verified supply chains and perform security validation before deployment. For BYOD, attestation checks that verify device integrity before granting access provide a layer of protection against preinstalled threats.
Mobile Malware Statistics: The Enterprise Blind Spot
Cross-referencing Kaspersky (33.3M attacks, 56% banking trojan growth) with Zimperium (70% unsecured BYOD, 83% mobile-optimised phishing) reveals that mobile is the most under-defended attack surface in most enterprises. Desktop endpoints typically have EDR, antivirus, and firewall protection. Mobile devices often have none. The 90% of attacks originating from endpoints includes mobile endpoints that many security programmes ignore entirely.
⛏️ Cryptojacking Statistics
SonicWall recorded 1.06 billion cryptojacking incidents in 2023, a 659% increase over 2022. Cryptojacking surpassed 2022's full-year total by early April 2023. Regional variations were extreme: Europe saw a 1,046% increase, North America 596%, APAC 87%, and Latin America 116%.
Cryptojacking has become an increasingly attractive vector for cybercriminals seeking low-risk, sustained revenue. Unlike ransomware, cryptojacking does not announce itself. Infected machines silently mine cryptocurrency, costing organisations in electricity, compute resources, and hardware degradation while generating income for attackers. Kaspersky also tracked 10.7 million crypto-related phishing attempts in 2024, targeting wallets and exchange credentials.
| Finding | Value | Source |
|---|---|---|
| Total cryptojacking hits (2023) | 1.06 billion | SonicWall 2024 Cyber Threat Report |
| Cryptojacking increase in Europe | 1,046% | SonicWall 2024 Cyber Threat Report |
| Crypto-related phishing attempts (2024) | 10.7 million | Kaspersky Financial Cyberthreats Report 2024 |
Cryptojacking: The Silent Drain
At 1.06 billion incidents, cryptojacking hits outnumber ransomware incidents by orders of magnitude. The economics favour attackers: low detection rates, no ransom negotiation required, and steady passive income. SonicWall's data suggests criminals are diversifying from high-risk ransomware to lower-risk cryptojacking. The 1,046% surge in Europe particularly correlates with high electricity costs making mining on stolen compute even more profitable for attackers relative to their own infrastructure.
How Cryptojacking Works
Cryptojacking installs mining software on victim machines, typically through compromised websites, trojanised applications, or exploited cloud instances. The malware uses victim CPU and GPU resources to mine cryptocurrency, primarily Monero due to its privacy features. Unlike ransomware, cryptojacking does not encrypt files or demand payment. Infected machines run slower, consume more electricity, and suffer accelerated hardware wear, but the infection often goes undetected for months.
Cloud cryptojacking has emerged as a particular concern. Attackers compromise cloud instances using stolen credentials or exposed APIs, then spin up mining workloads. A single compromised cloud account can generate thousands of dollars in compute charges before detection. CrowdStrike reported cloud intrusions increased 26% year-over-year, with cryptojacking as a leading motive for cloud-targeting attacks.
Detecting cryptojacking requires monitoring for performance anomalies: unexpected CPU spikes, increased electricity consumption, fan noise on servers, and unexplained cloud compute charges. Network-level detection can identify mining pool communication patterns. Endpoint detection tools that monitor process behaviour can flag mining binaries. The key challenge is that cryptojacking symptoms are subtle and often attributed to normal workload fluctuations before the true cause is identified.
The shift from ransomware to cryptojacking represents a broader trend in attacker economics. Ransomware generates large one-time payments but carries high risk: law enforcement attention, public exposure, and the possibility the victim refuses to pay. Cryptojacking generates smaller but consistent revenue with minimal risk of detection or prosecution. For criminal groups optimising for sustainable income rather than headline-grabbing scores, cryptojacking is the rational choice.
Cryptojacking Statistics by Region
Regional cryptojacking statistics show extreme variation. Europe experienced a 1,046% increase in cryptojacking hits in 2023, far outpacing other regions. North America followed at 596%, while APAC (87%) and Latin America (116%) saw more moderate growth. The European surge correlates with high electricity costs: mining cryptocurrency on stolen compute in a region where electricity costs $0.20-0.40/kWh is far more profitable for attackers than mining in regions where their own infrastructure would be cheaper to operate.
The convergence of cryptojacking and cloud infrastructure creates additional risk. Attackers who compromise cloud credentials can spin up GPU instances for mining at the victim's expense. A single compromised AWS or Azure account can rack up thousands of dollars in compute charges before the billing alert triggers. Some organisations have reported six-figure cloud bills from cryptojacking incidents that ran undetected for weeks.
🏭 Malware Attack Statistics by Industry
Manufacturing is the most-targeted sector globally, accounting for 27.7% of all cybersecurity incidents (IBM X-Force 2025). Ransomware attacks on manufacturing surged 61% year-over-year, and 68% of manufacturing firms reported that a malware infection caused a complete production stop at some point in 2025.
Healthcare remains a high-value target with 445 ransomware attacks recorded on providers in 2025. The Qilin ransomware-as-a-service group disproportionately targeted healthcare, claiming more healthcare victims than any other group. ICS and OT environments face mounting ransomware threats, with Kaspersky reporting a 20% increase in ICS-targeting ransomware in Q2 2024.
| Finding | Value | Source |
|---|---|---|
| Manufacturing share of all incidents (top sector) | 27.7% | IBM X-Force 2025 |
| Manufacturing firms with malware-caused production stop | 68% | Industry Research 2025 |
| Manufacturing ransomware increase YoY | 61% | Industrial Cyber 2025 |
| Healthcare provider ransomware attacks (2025) | 445 | Comparitech Healthcare Ransomware Roundup 2025 |
| ICS ransomware increase (Q2 2024) | 20% | Kaspersky ICS CERT |
Most Targeted Industries
- Manufacturing: 27.7% of all incidents
- Healthcare: 445 ransomware attacks in 2025
- Financial services: 300x more attacks than other sectors
- Critical infrastructure: IoT attacks up 124%
Industry-Specific Impact
- 68% of manufacturers had production fully stopped
- Ransomware in manufacturing up 61% YoY
- ICS ransomware increased 20% (Q2 2024)
- Ransom demands in manufacturing doubled to $1.16M
Why Manufacturing Is the Top Target
Manufacturing's position at 27.7% of incidents is not random. Cross-referencing IBM X-Force with SonicWall data reveals why: manufacturing environments run legacy OT systems that cannot be easily patched, they have low tolerance for downtime (making them more likely to pay ransoms), and the convergence of IT and OT networks creates exploitable bridges. The 68% production-stop rate confirms that attackers are successfully weaponising this operational dependency.
Healthcare Under Siege
Healthcare faced 445 ransomware attacks on direct care providers in 2025, plus 191 attacks on healthcare services companies including pharmaceutical manufacturers, billing providers, and health technology firms. The Qilin ransomware-as-a-service group claimed more healthcare victims than any other ransomware group, specifically targeting organisations with sensitive patient data and limited security budgets.
Manufacturing ransom demands more than doubled from $523,000 to $1.16 million on average. The operational technology environments in manufacturing, healthcare, and energy sectors present unique challenges: legacy systems that cannot be patched, regulatory requirements for uptime, and the growing convergence of IT and OT networks creating new attack paths. IoT attacks surged 124% (SonicWall), with unmanaged devices serving as primary entry points into industrial environments.
Financial Services: Volume and Sophistication
Financial services face 300 times more cyberattacks than other industries. Banks, insurance companies, and fintech firms are targeted by sophisticated malware campaigns designed to steal credentials, execute fraudulent transactions, and exfiltrate customer data. The sector's high-value data makes it a persistent target for both organised crime and nation-state actors.
Mobile banking trojans represent a particular threat to financial services. The 56% increase in banking trojan attacks (Kaspersky 2025) directly targets banking applications on customer smartphones. Mamont, the most prevalent banking trojan family at 49.8% of detections, specialises in overlay attacks that mimic legitimate banking apps to capture login credentials.
Critical Infrastructure and OT
Critical infrastructure sectors, including energy, water, and transportation, face a unique malware challenge. Operational technology (OT) systems were designed for reliability, not security. Many run decades-old software that cannot be patched without shutting down essential services. ICS ransomware increased 20% in Q2 2024 alone (Kaspersky ICS CERT), and the convergence of IT and OT networks creates exploitable bridges between internet-facing systems and physical infrastructure controls.
IoT attacks surging 124% (SonicWall) compounds the OT risk. Smart sensors, controllers, and connected devices deployed in critical infrastructure often lack basic security features like firmware signing, encrypted communications, or automatic updates. Once compromised, these devices provide persistent access to OT networks that traditional IT security tools do not monitor.
The Manufacturing-Healthcare Risk Nexus
Cross-referencing IBM X-Force and Comparitech data reveals a pattern: the most-targeted sectors are those with the lowest tolerance for downtime. Manufacturing (27.7% of incidents, 68% production stops) and healthcare (445 attacks, patient safety at stake) both face situations where paying a ransom is perceived as cheaper than extended outages. Attackers know this and deliberately target sectors where the cost of non-payment exceeds the ransom demand. The solution is not better negotiation; it is better resilience through tested backups, segmented networks, and incident response plans.
🔍 Malware Detection & Evasion
Top antivirus products achieve detection rates above 99.95% in controlled lab tests (AV-Comparatives 2025). Microsoft Defender and Norton achieved perfect protection scores in June 2025 testing. However, these lab results do not fully reflect real-world conditions where attackers specifically design malware to evade detection.
76% of detected malware now exhibits AI-driven polymorphism, meaning it changes its code structure in real time to evade signature-based detection. AI-powered security tools identify novel malware patterns with 300% more accuracy than traditional signature-based systems. The average dwell time between infection and detection has dropped to 10 days in 2025, down from 16 days in 2023. SonicWall reports that 61% of the time, attackers exploited new vulnerabilities within just 2 days.
| Finding | Value | Source |
|---|---|---|
| Never-before-seen malware variants (2024) | 210,258 | SonicWall 2025 Cyber Threat Report |
| Top antivirus detection rate (lab tests) | 99.95% | AV-Comparatives 2025 |
| Malware exhibiting AI-driven polymorphism | 76% | SecurityWeek / Industry Analysis |
| AI detection accuracy improvement over signature-based | 300% | Industry Analysis 2025 |
| Average dwell time (infection to detection) | 10 days | Mandiant / Industry Reports |
| Hackers exploiting new vulns within 2 days | 61% | SonicWall 2025 Cyber Threat Report |
| Encrypted threats increase YoY | 93% | SonicWall 2025 Cyber Threat Report |
Detection Rate Calculator
Select the security tools in your stack to estimate your malware detection coverage.
The Arms Race: Polymorphism vs AI Detection
76% of malware now uses AI-driven polymorphism, changing its code with every execution. At the same time, AI-based defences detect novel patterns 300% more accurately than signature matching. The defenders and attackers are locked in an AI arms race. The dwell time dropping from 16 to 10 days is partly a defensive win (faster detection) and partly a threat (AI-enabled malware completes objectives faster). Organisations still relying solely on signature-based antivirus are fighting the last war.
Detection by the Numbers
Top antivirus products detect over 99.95% of known malware in controlled lab tests (AV-Comparatives 2025). Microsoft Defender and Norton both achieved 100% protection scores in June 2025 testing. Kaspersky had the lowest false positive rate at just 9 false detections, followed by Total Defense (12) and Bitdefender (19). These numbers reflect lab conditions; real-world malware detection rates are lower due to zero-day variants, encrypted delivery, and evasion techniques.
SonicWall's annual tally of never-before-seen malware variants highlights the gap between lab tests and reality. These are variants that had never appeared in any signature database. The 61% rate at which attackers exploit new vulnerabilities within 2 days further compresses the detection window. Organisations have an average of 120-150 days to apply patches (SonicWall), creating a wide window of exposure between vulnerability disclosure and remediation.
Detection Strengths
- 99.95% detection in lab tests
- AI tools: 300% more accurate than signatures
- Dwell time reduced to 10 days
- 84% of users have antivirus installed
- Low false positive rates (<0.01%)
Detection Gaps
- 200K+ never-before-seen variants bypass signatures
- 76% of malware is polymorphic
- 45% hides in encrypted traffic
- Patch window: 120-150 days average
- Only 25% rate AV as 'very effective'
The Patch Window Problem
SonicWall data reveals that attackers exploit new vulnerabilities within 2 days 61% of the time, yet the average organisation takes 120-150 days to apply patches. This 118-148 day gap represents one of the largest systemic detection and prevention failures in cybersecurity. During this window, organisations are knowingly vulnerable to exploits that attackers are actively using.
The patch window problem is compounded in OT and IoT environments where patching often requires system downtime that operational teams resist. Manufacturing lines running 24/7, hospital medical devices treating patients, and utility SCADA systems managing power grids cannot simply be rebooted for patches. This creates a structural vulnerability that attackers specifically target: the 27.7% manufacturing incident rate and 124% IoT attack surge are direct consequences of this patching gap.
Virtual patching through web application firewalls (WAFs) and intrusion prevention systems (IPS) can provide interim protection while permanent patches are deployed. Network segmentation limits the blast radius of exploited vulnerabilities. However, neither approach substitutes for actual patching. Organisations that cannot patch within 14 days should assume compromise and invest in detection and response capabilities to catch exploitation in progress.
The 118-Day Exposure Window
Cross-referencing SonicWall's data: 61% of exploits hit within 2 days, but patches take 120-150 days. This 118+ day gap is the single largest structural vulnerability in most organisations. Prioritising critical patches to within 14 days of disclosure, combined with virtual patching for systems that cannot be immediately updated, would close the majority of this exposure window.
Malware detection effectiveness ultimately depends on a layered approach. No single tool, whether antivirus, EDR, sandbox, or AI-based, catches everything. The 99.95% lab detection rate drops significantly in the wild because attackers design around specific products. Organisations running multiple complementary layers, including network-based detection, endpoint behavioural analysis, email filtering, and cloud access security, achieve the highest real-world detection rates. The Detection Rate Calculator above illustrates this layering principle.
📧 Malware Delivery Methods
94% of all malware reaches its target via email, making it the overwhelming primary delivery vector. Phishing emails carrying malicious attachments or links account for the vast majority. SonicWall reports that 45% of malware now hides within SSL/TLS encrypted traffic, making it invisible to traditional firewalls that do not perform TLS inspection.
Supply chain attacks emerged as a major vector in 2025, with attackers publishing over 15,000 malicious packages to open-source registries like NPM and PyPI. IoT attacks surged 124% year-over-year (SonicWall), as unmanaged devices provide entry points into corporate networks. Encrypted threats climbed 93%, further complicating detection for organisations without SSL inspection capabilities.
| Finding | Value | Source |
|---|---|---|
| Malware delivered via email | 94% | Verizon DBIR / Cleartech Group |
| Malware hiding in SSL/TLS encrypted traffic | 45% | SonicWall 2025 Cyber Threat Report |
| Malicious packages in open-source registries (2025) | 15,000+ | Barracuda Networks / Industry Reports |
| IoT attacks increase year-over-year | 124% | SonicWall 2025 Cyber Threat Report |
| Encrypted threats increase YoY | 93% | SonicWall 2025 Cyber Threat Report |
| Threats that are web-based | 95% | Gen Q2/2024 Threat Report |
The Encrypted Traffic Blind Spot
45% of malware now travels through SSL/TLS encrypted connections. Combined with SonicWall's 93% increase in encrypted threats, organisations without TLS inspection have a growing blind spot. Most enterprise firewalls can inspect encrypted traffic, but many do not enable it due to performance concerns or certificate management complexity. This creates an obvious path for attackers: wrap malware in encryption and walk through the front door.
Supply Chain Poisoning
Supply chain attacks escalated dramatically in 2025, with attackers publishing over 15,000 malicious packages to open-source registries like NPM and PyPI. These packages masquerade as legitimate libraries, using typosquatting and dependency confusion to trick developers into installing backdoored code. Once integrated into a build pipeline, the malicious code propagates to every application that depends on it.
46.75% of breaches involved technology products and services, underscoring the systemic exposure through vendor and partner ecosystems. The ClickFix social engineering campaigns seen in 2025 used VBScript and PowerShell dropper scripts instead of traditional executable attachments, further evading endpoint detection. USB-based delivery, while less common at approximately 9%, remains effective against air-gapped industrial environments.
Email Dominance in Delivery
94% of malware arrives via email. This single statistic should drive security budget allocation more than any other. Email security gateways, phishing simulations, DMARC/DKIM/SPF enforcement, and user awareness training collectively address the vector through which nearly all malware enters. Every dollar spent on email security protects against 94% of the threat.
Open-Source Supply Chain Risk
The 15,000+ malicious packages published to NPM and PyPI in 2025 represent a systemic risk to software development. Attackers use typosquatting (registering packages with names similar to popular libraries), dependency confusion (exploiting package resolution priorities), and account compromise to inject malicious code into legitimate build pipelines. Once a malicious package enters a dependency chain, it propagates to every application that builds on it.
The SolarWinds and MOVEit incidents of previous years were not isolated events but indicators of a sustained campaign against software supply chains. Organisations that do not scan dependencies, pin package versions, and monitor for unexpected updates are exposed to supply chain malware that bypasses all traditional perimeter defences. This is a critical area of malware detection improvement needed across the industry.
The 93% increase in encrypted threats deserves particular attention. As more internet traffic moves to HTTPS (over 95% of web traffic is now encrypted), attackers increasingly wrap malware in legitimate SSL/TLS connections. Without deep packet inspection of encrypted traffic, firewalls see only the encrypted envelope and cannot inspect the payload. Enabling TLS inspection requires careful certificate management and can introduce performance overhead, but the alternative is a growing blind spot covering 45% of malware delivery.
IoT attacks surging 124% (SonicWall 2024) reflect another delivery vector gaining momentum. Unmanaged smart devices, cameras, printers, and industrial sensors often run outdated firmware with known vulnerabilities. Once compromised, they serve as beachheads for lateral movement into corporate networks. The combination of IoT proliferation and limited security tooling for these devices creates an expanding attack surface.
💰 Cost of Malware Attacks
The average cost of a ransomware attack reached $5.13 million in 2024. But the ransom payment itself accounts for only about 15% of total costs. The remaining 85% comes from operational downtime (averaging 24 days), system restoration, legal fees, regulatory fines, and reputational damage. Downtime costs can reach 50 times the ransom demand.
This means a $200,000 ransom can produce $10M+ in total business impact. Manufacturing firms saw ransom demands more than double to $1.16 million on average, while the healthcare sector faces the compounding cost of patient data exposure. Global ransomware-related costs are projected to total $57 billion in 2025.
| Finding | Value | Source |
|---|---|---|
| Average cost of a ransomware attack | $5.13M | Acronis / Industry Reports |
| Average downtime from ransomware | 24 days | Industry Reports 2025 |
| Downtime cost relative to ransom demand | 50x | Huntress / Industry Analysis |
| Ransom payment as percentage of total cost | 15% | BlackFog / Industry Analysis |
The True Cost (85%)
- Operational downtime: 24 days average
- System restoration and recovery
- Legal fees and regulatory fines
- Reputational damage and lost customers
- Incident response and forensics
The Ransom Payment (15%)
- Median ransom demand varies widely
- Only 15% of total cost
- Paying does not guarantee recovery
- 64% of organisations now refuse to pay
- Attacked again after paying: common
Downtime Is the Real Cost Multiplier
At 50x the ransom demand, downtime dwarfs the ransom payment. Cross-referencing Sophos, Acronis, and IBM data: the average organisation loses millions per ransomware incident, but organisations with tested incident response plans and backups reduce this by 30-40%. The 15% figure for ransom as a share of total cost means organisations that pay ransoms are still facing millions in recovery. Prevention and preparation deliver far better ROI than payment.
The Hidden Costs
Beyond direct financial losses, malware attacks carry significant secondary costs. Reputational damage leads to customer churn. Regulatory fines under GDPR, HIPAA, and PCI DSS can reach millions. Class action lawsuits following data breaches add another cost layer. Staff layoffs following ransomware attacks are common: Fortinet data shows a significant percentage of organisations reduce headcount after a major incident.
Global ransomware-related costs are projected to total $57 billion in 2025. That figure includes ransom payments, recovery costs, lost productivity, and third-party expenses. The projection rises to $275 billion annually by 2031 (Cybersecurity Ventures). For individual organisations, the key insight is that prevention costs a fraction of recovery. A comprehensive security stack costing $500,000 annually is cheap insurance against the multi-million-dollar average incident cost.
Prevention ROI
A $500K annual security budget protecting against the average multi-million-dollar ransomware cost delivers roughly 10x ROI. Even reducing incident probability by 50% through basic controls (EDR, MFA, email security, backups) justifies the investment. The 24-day average downtime alone can cost more than a decade of security tooling.
Cost by Attack Type
Malware attack costs vary significantly by type. Ransomware commands the highest average cost, driven by the combination of data encryption, operational downtime, and extortion demands. Data-stealing trojans and spyware typically cost less per incident ($500K-$2M) but can cause long-term damage through intellectual property theft and regulatory penalties. Cryptojacking costs are harder to quantify as they present as inflated utility and cloud bills rather than dramatic incidents, but a single cloud cryptojacking event can generate five-figure charges within days.
The 24-day average downtime figure is particularly significant for manufacturing (where every day of shutdown costs can run into the millions), healthcare (where patient care is disrupted), and financial services (where regulatory and reputational consequences compound rapidly). Fortinet data shows organisations that pay ransoms are frequently attacked again, indicating that payment does not reduce future risk. The 64% of organisations now refusing to pay reflects growing awareness that ransom payment is a poor investment.
Business email compromise (BEC), often enabled by malware-harvested credentials, remains one of the costliest categories reported to the FBI IC3 at $2.9 billion in 2024 losses. BEC losses often exceed ransomware because they involve direct financial fraud rather than system disruption. The convergence of credential-stealing malware and BEC fraud creates a pipeline: malware harvests credentials, attackers use those credentials to impersonate executives, and fraudulent wire transfers empty accounts.
Cyber Insurance and Malware Costs
The cost of malware attacks increasingly interacts with cyber insurance. SonicWall reports that 33% of reported cyber insurance events are now BEC incidents, up from 9% year-over-year. Insurance carriers are responding by tightening requirements: MFA, EDR deployment, and tested backup procedures are now prerequisites for coverage, not optional improvements. Organisations without these controls face higher premiums, lower coverage limits, or outright denial of claims.
The average ransomware cost exceeds many organisations' cyber insurance policy limits. Even organisations with coverage face significant out-of-pocket costs from deductibles, business interruption periods beyond policy coverage, and reputational damage that insurance cannot compensate. The most cost-effective strategy remains prevention: a well-funded security programme that reduces incident probability delivers better financial outcomes than relying on insurance to cover post-incident costs.
For organisations building business cases for malware defence investment, the cost data provides clear financial arguments. A $500,000 annual security investment against the average ransomware incident cost provides roughly 10x ROI at even modest risk reduction. The 24-day average downtime translates to weeks of lost revenue that dwarf the cost of preventive tools. When combined with the 50x downtime multiplier over ransom demands, the financial case for prevention over payment is overwhelming.
🤖 AI and Malware
80% of ransomware attacks now use artificial intelligence in some capacity, from generating convincing phishing emails to automating lateral movement. AI-driven credential theft surged 160% in 2025, with over 14,000 breaches recorded in a single month. Google Threat Intelligence Group identified the first malware families, PROMPTFLUX and PROMPTSTEAL, that use large language models during execution to dynamically generate malicious scripts and obfuscate their own code.
76% of detected malware now exhibits AI-driven polymorphism, changing its underlying code structure with every execution to evade signature-based detection. The average dwell time has dropped to 10 days (from 16 in 2023), partly because AI-enabled malware completes objectives faster. On the defensive side, AI security tools detect novel malware patterns with 300% more accuracy than signature-based systems, and 79% of attacks are now malware-free, making behavioural AI detection more critical than file scanning.
| Finding | Value | Source |
|---|---|---|
| Ransomware attacks using AI | 80% | IntelligenceX Cybersecurity 2025 |
| AI-driven credential theft increase | 160% | Industry Reports 2025 |
| Malware with AI-driven polymorphism | 76% | SecurityWeek / Industry Analysis |
| Average dwell time (infection to detection) | 10 days | Mandiant / Industry Reports |
| AI detection accuracy vs signature-based | 300% | Industry Analysis 2025 |
| Attacks that are now malware-free | 79% | CrowdStrike 2025 Global Threat Report |
Malware Risk Assessment
Answer these 8 questions about your organisation's defences to get a risk score.
1. Do you have endpoint detection and response (EDR)?
2. Is MFA enforced for all users?
3. Do you inspect SSL/TLS traffic?
4. Do you have tested backup and recovery procedures?
5. Do employees receive phishing awareness training?
6. Do you have a mobile device management (MDM) policy?
7. Do you monitor for credential compromise / dark web exposure?
8. Do you use AI/ML-based security tools?
LLM-Powered Malware Is Here
Google Threat Intelligence Group confirmed the first malware families (PROMPTFLUX and PROMPTSTEAL) that use large language models during runtime execution. These programs dynamically generate malicious scripts and obfuscate their own code using AI, making every instance unique. Combined with 76% polymorphism rates and 80% AI usage in ransomware, the malware ecosystem has decisively adopted AI. Defenders without AI-powered detection tools face an asymmetric disadvantage.
AI on Defence
AI security tools now detect novel malware patterns with 300% more accuracy than traditional signature-based systems. This improvement comes from behavioural analysis: rather than matching known signatures, AI models identify malicious behaviour patterns regardless of code structure. The approach is essential against polymorphic malware that changes its signature with every execution.
The dwell time dropping from 16 days in 2023 to 10 days in 2025 reflects both improvements in defensive AI and the increasing speed at which AI-enabled malware operates. AI-powered ransomware has cut median dwell time to as low as 5 days in some campaigns, completing data exfiltration and encryption faster than manual response teams can react. Automated detection and response are no longer optional; they are the only way to match attack speed.
AI for Attackers
- 80% of ransomware uses AI
- 76% polymorphic malware (code mutation)
- LLM-powered PROMPTFLUX/PROMPTSTEAL families
- AI-driven credential theft up 160%
- Dwell time compressed to 5-10 days
AI for Defenders
- 300% better novel malware detection
- Behavioural analysis bypasses polymorphism
- Automated response matches attack speed
- Anomaly detection catches credential abuse
- Reduced false positive rates in modern AV
The key malware trend for 2026 is clear: the threat landscape has become an AI-vs-AI contest. Organisations still relying on signature-based detection are fighting with outdated weapons. The 79% malware-free attack rate means even perfect file-based detection misses four out of five initial access attempts. Behavioural AI, identity monitoring, and zero-trust architecture form the modern defence stack.
AI-Generated Phishing and Malware Delivery
AI has transformed the quality of phishing campaigns that deliver malware. AI-generated phishing emails achieve higher click rates than human-crafted ones (Harvard Business Review reports 54% click-through rates for AI phishing). The cost reduction is equally significant: AI phishing campaigns cost approximately 95% less than manual operations while achieving comparable or better results.
CrowdStrike's 442% increase in vishing (voice phishing) attacks reflects another AI-enabled delivery vector. Voice cloning and AI-powered voice impersonation enable attackers to convincingly impersonate executives, IT staff, or vendors in telephone calls that trick employees into installing malware, sharing credentials, or authorising fraudulent transactions. The convergence of AI-generated text, voice, and video deepfakes creates a multi-channel social engineering threat that traditional email filters cannot address.
The AI Adoption Gap Between Attackers and Defenders
80% of ransomware already uses AI, yet many organisations have not deployed AI-powered defensive tools. Cross-referencing this with the 300% accuracy improvement AI detection provides over signatures, the gap represents a clear strategic disadvantage. Organisations that deploy AI detection tools today gain a measurable edge. Those that wait will face an increasingly AI-equipped adversary with 1990s-era defences.
Malware Defence Priorities for 2026
Based on the data above, here are the evidence-based defence priorities for 2026. Each recommendation is tied to specific data points rather than general advice.
Priority Defence Stack (Based on Malware Data)
- Email Security Gateway + DMARC/DKIM/SPF — addresses 94% of malware delivery.
- Identity Security (MFA + credential monitoring) — addresses 79% malware-free initial access.
- EDR with AI/behavioural detection — addresses 76% polymorphic malware that evades signatures.
- TLS inspection on firewall — addresses 45% of malware hiding in encrypted traffic.
- Mobile Threat Defence (MTD) — addresses 33.3M mobile attacks and 56% banking trojan surge.
- Tested backup and recovery — reduces 24-day average downtime and eliminates ransom payment incentive.
- Supply chain security (SCA, dependency scanning) — addresses 15,000+ malicious packages.
- OT/IoT segmentation — addresses 124% IoT attack surge and 27.7% manufacturing targeting.
No single tool or vendor addresses all malware threats. The data consistently shows that layered defence, covering email, identity, endpoint, network, and cloud, delivers the best outcomes. Organisations with AI/ML security automation save $1.90 million per breach compared to those without (IBM 2025). The investment in defence always costs less than the incident.
Measuring Malware Risk: What Matters
When evaluating your organisation's malware risk, the statistics in this article point to specific metrics to track. Mean time to detect (MTTD) should be benchmarked against the 10-day industry average dwell time; organisations detecting faster than this are outperforming the norm. Patch latency should target under 14 days for critical vulnerabilities, closing the gap against the 2-day exploit window. Email click rates from phishing simulations should benchmark below 5%; anything higher indicates training gaps in the 94% email delivery vector.
MFA adoption should target 100% of user accounts; any exceptions are potential access broker entry points. Mobile device compliance should track the percentage of devices with MTD installed and up-to-date; benchmark against Zimperium's 70% unsecured figure and aim for under 10%. Backup recovery testing frequency and success rate are critical metrics given the 24-day downtime average. Organisations that test quarterly and achieve under 4-hour recovery time objectives dramatically reduce their ransomware exposure.
These are not just data points for reports. They are benchmarks for measuring your own security posture. If your organisation detects threats slower than 10 days, patches slower than 14 days, has MFA adoption below 90%, or lacks email security covering the 94% delivery vector, these statistics quantify the specific risks you are carrying. Use the interactive tools above to estimate your detection coverage and risk score as a starting point.
🎯 Key Takeaways
- Volume is relentless: 450,000+ new malware samples appear daily, but the bigger shift is toward malware-free attacks (79% of initial access).
- Identity is the new perimeter: Stolen credentials, access brokers (+50%), and living-off-the-land techniques have overtaken traditional malware as the primary attack method.
- Email remains the gateway: 94% of malware arrives via email. Phishing training and email security are the highest-ROI defences.
- AI is on both sides: 80% of ransomware uses AI, 76% of malware is polymorphic, but AI defences detect 300% more accurately than signatures.
- Mobile is under siege: Banking trojans surged 56% in 2025. 70% of workers use unsecured personal devices, creating a direct path to enterprise data.
- Manufacturing pays the highest price: 27.7% of all incidents target manufacturing, with 68% experiencing complete production stops.
- The ransom is not the cost: At 15% of total attack cost and 50x downtime multiplier, prevention and response planning deliver far better ROI than payment.
- Encrypt your detection: 45% of malware hides in encrypted traffic. Without TLS inspection, nearly half of malware walks through unexamined.
What These Malware Statistics Mean for You
If you are a security professional, the numbers point to three priority investments for 2026. First, identity security: with 79% of attacks bypassing malware entirely, MFA enforcement, credential monitoring, and access broker detection are essential. Second, AI-powered detection: signature-based antivirus alone misses 76% of polymorphic malware, and AI tools detect novel patterns 300% more accurately. Third, email security: 94% of malware arrives via email, making this the single highest-ROI layer.
If you are an executive or board member, the cost data drives the business case. Multi-million-dollar average ransomware costs, 24 days of downtime, and a 50x cost multiplier over the ransom demand make prevention investments obvious. Manufacturing firms (27.7% of incidents) and healthcare providers (445 attacks in 2025) face the highest sector-specific risks.
If you are a student or career changer entering cybersecurity, these shifts define the skills in demand. Incident response, threat hunting, cloud security, mobile threat defence, and AI/ML security operations are the fastest-growing roles. The shift from file-based detection to behavioural analysis means the industry needs analysts who understand adversary tradecraft, not just signature databases.
The Bottom Line
The malware landscape in 2026 is defined by a paradox: more malware than ever exists (1.56 billion samples, hundreds of thousands of new variants daily), yet the most effective attacks use no malware at all (79% malware-free). Defending against both requires layered security that covers identity, endpoints, email, network, and cloud. No single tool is sufficient. The organisations that invest across all layers, powered by AI detection, will weather the threat. Those that do not will join the statistics.
❓ Frequently Asked Questions
How much new malware is created daily?
Over 450,000 new malware and potentially unwanted programs (PUA) are detected every day by AV-TEST Institute. That is approximately 312 per minute or 5 per second. The total number of known malware samples has surpassed 1.56 billion.
How common is malware compared to other cyber threats?
Traditional malware now accounts for only 21% of initial-access attacks. 79% of attacks gaining initial access are malware-free, using stolen credentials, living-off-the-land techniques, and identity-based methods (CrowdStrike 2025). However, malware remains extremely common in volume terms, with over 1 billion attacks blocked monthly by Gen Digital alone.
What is the most common type of malware?
Trojans are the most common type of malware, accounting for approximately 58% of all malware detections (AV-TEST). Trojans disguise themselves as legitimate software to gain system access. Ransomware (14%) causes the most financial damage per incident, while adware (8%) is the most common on mobile devices at 62% of mobile detections.
How much does a malware attack cost?
The average ransomware attack costs $5.13 million (Acronis 2024). The ransom payment itself accounts for only about 15% of total costs. The remaining 85% comes from operational downtime (averaging 24 days), system restoration, legal fees, and reputational damage. Downtime costs can reach 50x the ransom demand.
What are the main malware trends for 2026?
The major malware trends for 2026 are: (1) the shift to malware-free attacks using stolen credentials (79% of initial access); (2) AI-powered malware with 76% polymorphism rates and the first LLM-using malware families; (3) surging mobile banking trojans (+56%); (4) supply chain poisoning through open-source registries (15,000+ malicious packages); and (5) cryptojacking as a low-risk alternative to ransomware.
What industries are most targeted by malware?
Manufacturing is the most-targeted sector, accounting for 27.7% of all cybersecurity incidents (IBM X-Force 2025). Healthcare faced 445 ransomware attacks on providers in 2025. Financial services face 300x more attacks than other industries. Manufacturing ransomware attacks surged 61% year-over-year, and 68% of manufacturers experienced complete production stops from malware.
How is malware typically delivered?
94% of all malware is delivered via email, primarily through phishing emails with malicious attachments or links. 45% of malware hides within SSL/TLS encrypted traffic. Supply chain attacks through poisoned open-source packages (15,000+ in 2025) are a growing vector. Web-based threats account for 95% of consumer detections (Gen Digital). IoT device attacks surged 124% (SonicWall).
What is cryptojacking and how widespread is it?
Cryptojacking is malware that uses victim computing resources to mine cryptocurrency without the user's knowledge. SonicWall recorded 1.06 billion cryptojacking incidents in 2023, a 659% increase over 2022. Europe saw a 1,046% surge. Cryptojacking has become attractive to criminals because it generates passive income with lower detection rates and lower legal risk than ransomware.
About This Data
This article draws from 55 statistics aggregated from 50+ authoritative sources including IBM Cost of a Data Breach, Verizon DBIR, CrowdStrike Global Threat Report, WEF Global Cybersecurity Outlook, FBI IC3, ISC2 Cybersecurity Workforce Study, Sophos, Gartner, Mandiant M-Trends, and Ponemon Institute reports.
Derived statistics (marked "Nathan House's Analysis") are computed by cross-referencing data from multiple sources — for example, comparing breach costs across industries using IBM data, or validating ransomware trends across Verizon, Sophos, and HIPAA Journal findings.
All statistics include inline source citations with links to primary sources. Data spans 2023-2026, with preference given to the most recent available figures. Last updated: June 2026.
How to Use This Data
Security professionals can use this data to build business cases for cybersecurity investment, benchmark detection capabilities, justify EDR and AI security budgets, and communicate risk to executive stakeholders. The derived statistics cross-reference multiple reports to surface insights not available in any single source.
For board-level presentations: lead with the cost data (average ransomware cost, 24-day downtime, 50x multiplier) and the identity shift (79% malware-free attacks). For security team planning: use the delivery method breakdown (94% email, 45% encrypted) and detection gap data (76% polymorphic, hundreds of thousands of novel variants) to justify specific tool investments.
For risk assessments: the industry data (manufacturing 27.7%, healthcare 445 attacks) and mobile statistics (33.3M attacks, 70% unsecured BYOD) provide benchmarks for sector-specific risk quantification. For training programmes: the 94% email delivery rate and 79% malware-free finding demonstrate why phishing awareness and credential hygiene are the highest-impact training topics.
This page is updated monthly as new reports are published. Bookmark it and return for the latest data. If you spot an outdated statistic or want to suggest a source, contact us.
Sources Used in This Article
This article draws from AV-TEST Institute, CrowdStrike 2025 Global Threat Report, SonicWall 2025 Cyber Threat Report, Kaspersky Mobile Threat Reports (2024 and 2025), Zimperium Mobile Threat Report 2024, Gen Digital Threat Reports, IBM X-Force 2025, Verizon DBIR 2025, AV-Comparatives 2025, Google Threat Intelligence Group, Acronis, Comparitech, Darktrace, Industrial Cyber, Barracuda Networks, SecurityWeek, and BlackFog. All statistics include inline source citations with links to primary reports.
Related Reading on StationX
- Ransomware Statistics — for deeper analysis of ransomware payment trends, recovery costs, and top threat groups.
- Phishing Statistics — for email-specific threat data, AI phishing trends, and click rate analysis.
- Cybercrime Statistics — for the broader picture of global cybercrime costs, workforce gaps, and country data.
- Data Breach Statistics — for breach cost analysis by industry, country, and attack vector.
About the Author

Nathan House, Founder & CEO of StationX
Nathan House has 30 years of hands-on cybersecurity experience and is Cambridge-educated, holding CISSP, CISA, CISM, OSCP, CEH, and SABSA. He founded StationX in 1999 — one of the UK’s first cybersecurity companies — and has secured £71 billion in UK mobile banking transactions and the London 2012 Olympics, advising clients including Microsoft, Cisco, BP, Vodafone, and VISA. He authored the world’s most popular cybersecurity course — a #1 Udemy bestseller taken by over 500,000 students — and was named Cyber Security Educator of the Year 2020, AI Security Educator of the Year, and a UK Top 25 Security Influencer 2025. A DEF CON speaker and featured expert on CNN, Fox News, NBC, and the BBC, Nathan leads StationX’s training of more than half a million students worldwide.