Cybercrime Statistics [2026]: 500+ Facts & Trends

$10.5 trillion. That's what cybercrime costs the global economy every year — more than the GDP of every country except the US and China. If you're looking for the latest cyber crime statistics worldwide to understand the scale of the threat, build a business case for security investment, or cite in your own research, you're in the right place.
I've aggregated 1479+ cybersecurity statistics 2026 from over 50 authoritative sources — IBM, Verizon, CrowdStrike, the FBI, ISC2, Sophos, Gartner, and more — and cross-referenced them to produce original analysis you won't find in any single report. You'll find cyber attack statistics, data breach costs, ransomware trends, phishing data, AI-powered threats, workforce gaps, and country-level breakdowns across 18 sections below.
Key Cybercrime Statistics at a Glance
- $10.5 trillion — annual global cybercrime cost (Cybersecurity Ventures)
- $4.44 million — average data breach cost, down 9% from 2024 (IBM)
- 44% of breaches now involve ransomware, up from 32% (Verizon DBIR)
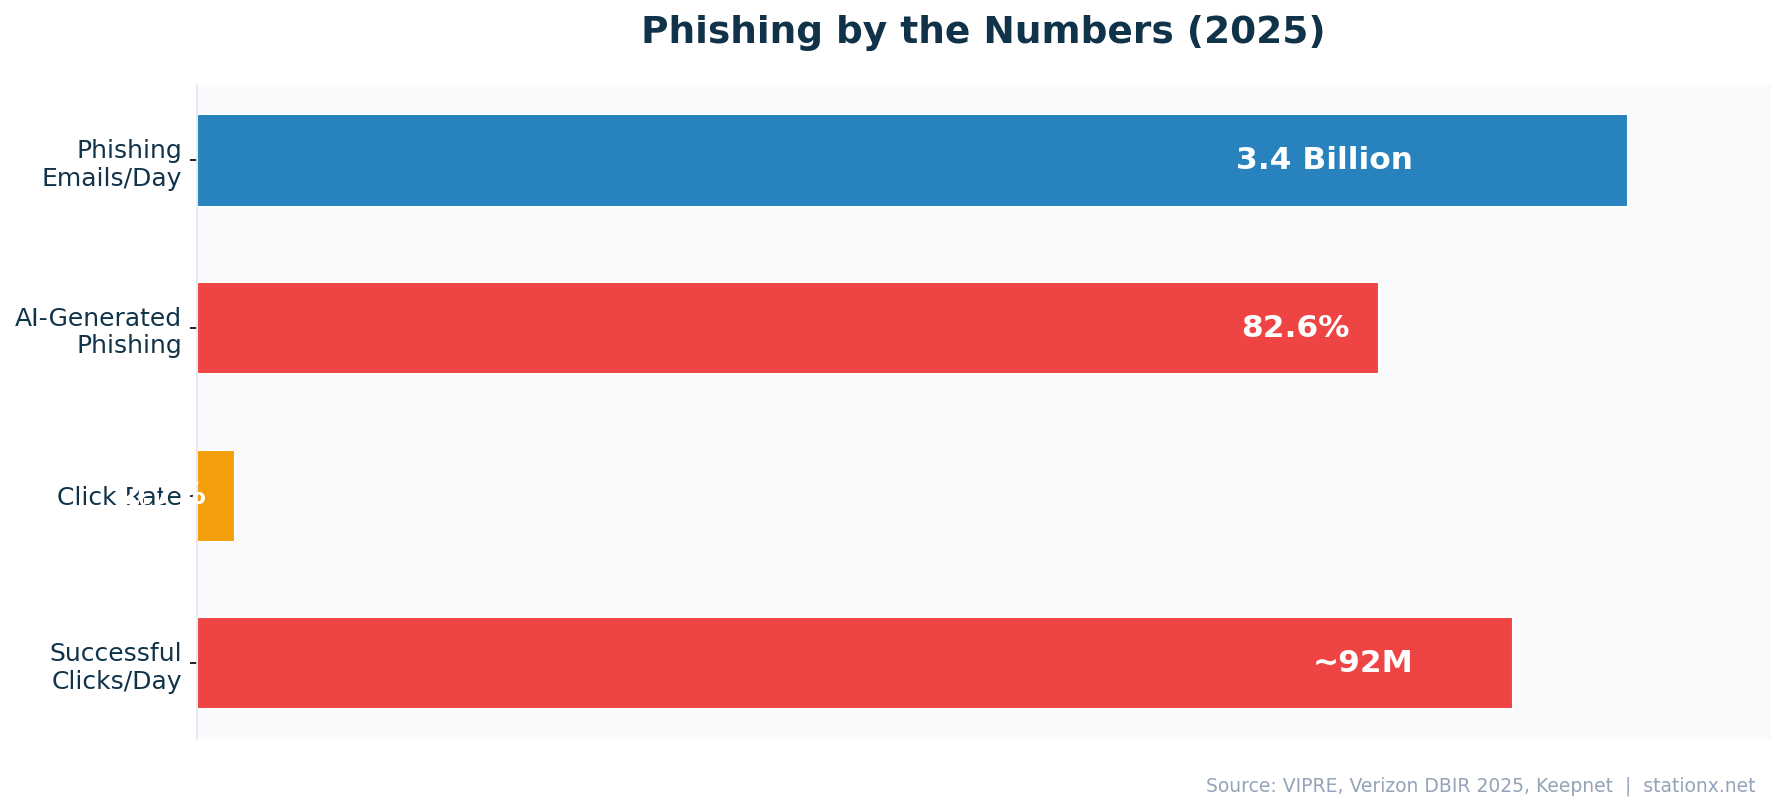
- 3.4 billion phishing emails sent daily; 82.6% are AI-generated
- $16.6 billion in FBI-reported cybercrime losses in 2024 (+33% YoY)
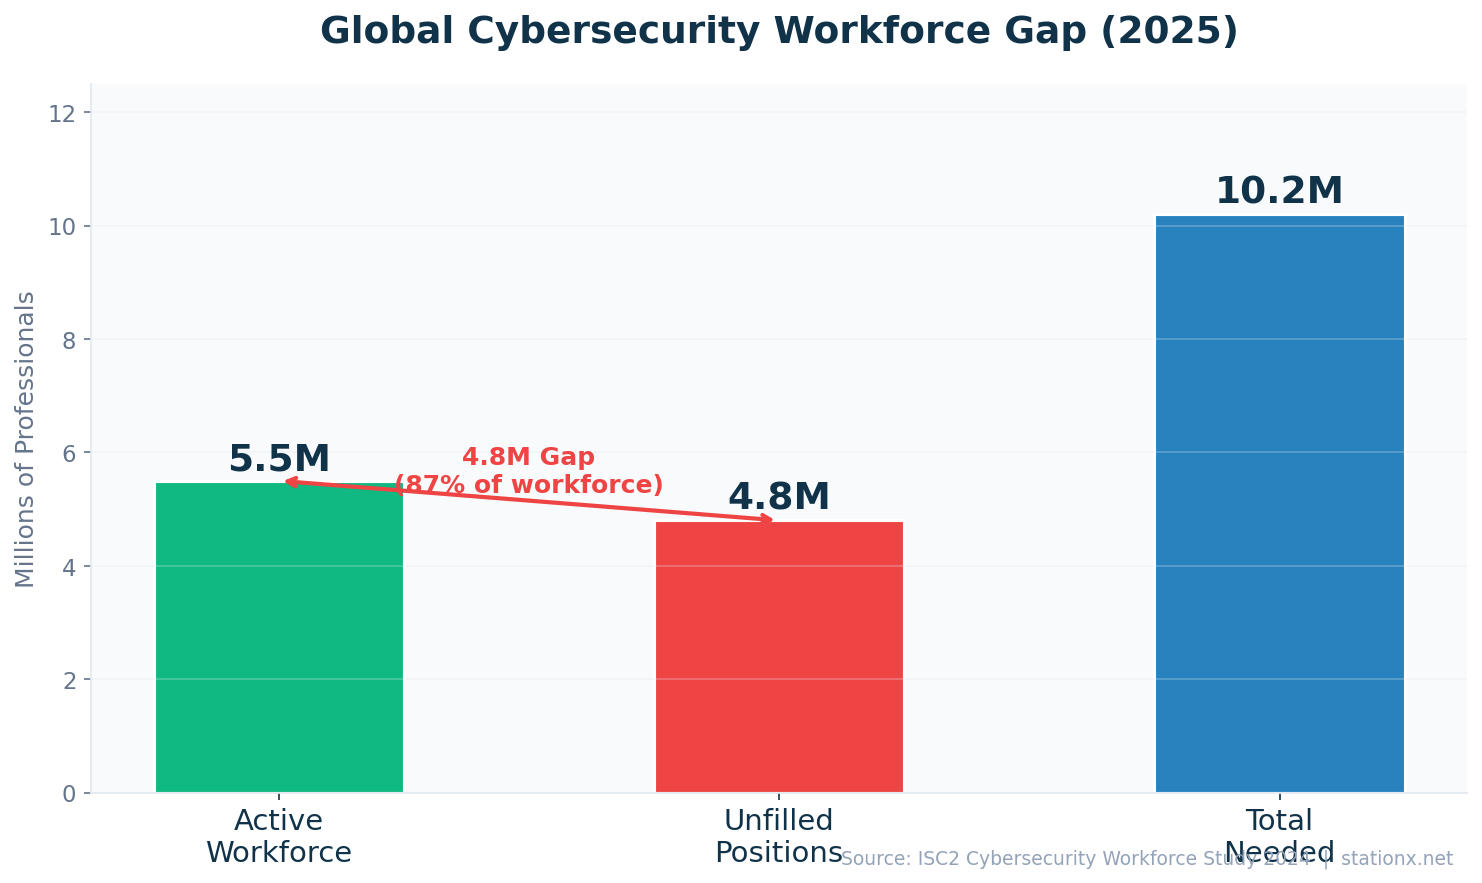
- 4.8 million unfilled cybersecurity positions worldwide (ISC2)
- 64% of ransomware victims now refuse to pay (Verizon DBIR)
- $1.9 million saved per breach with AI/automation (IBM)
Last updated: June 2026
📊 Key Cybercrime Numbers (2026)
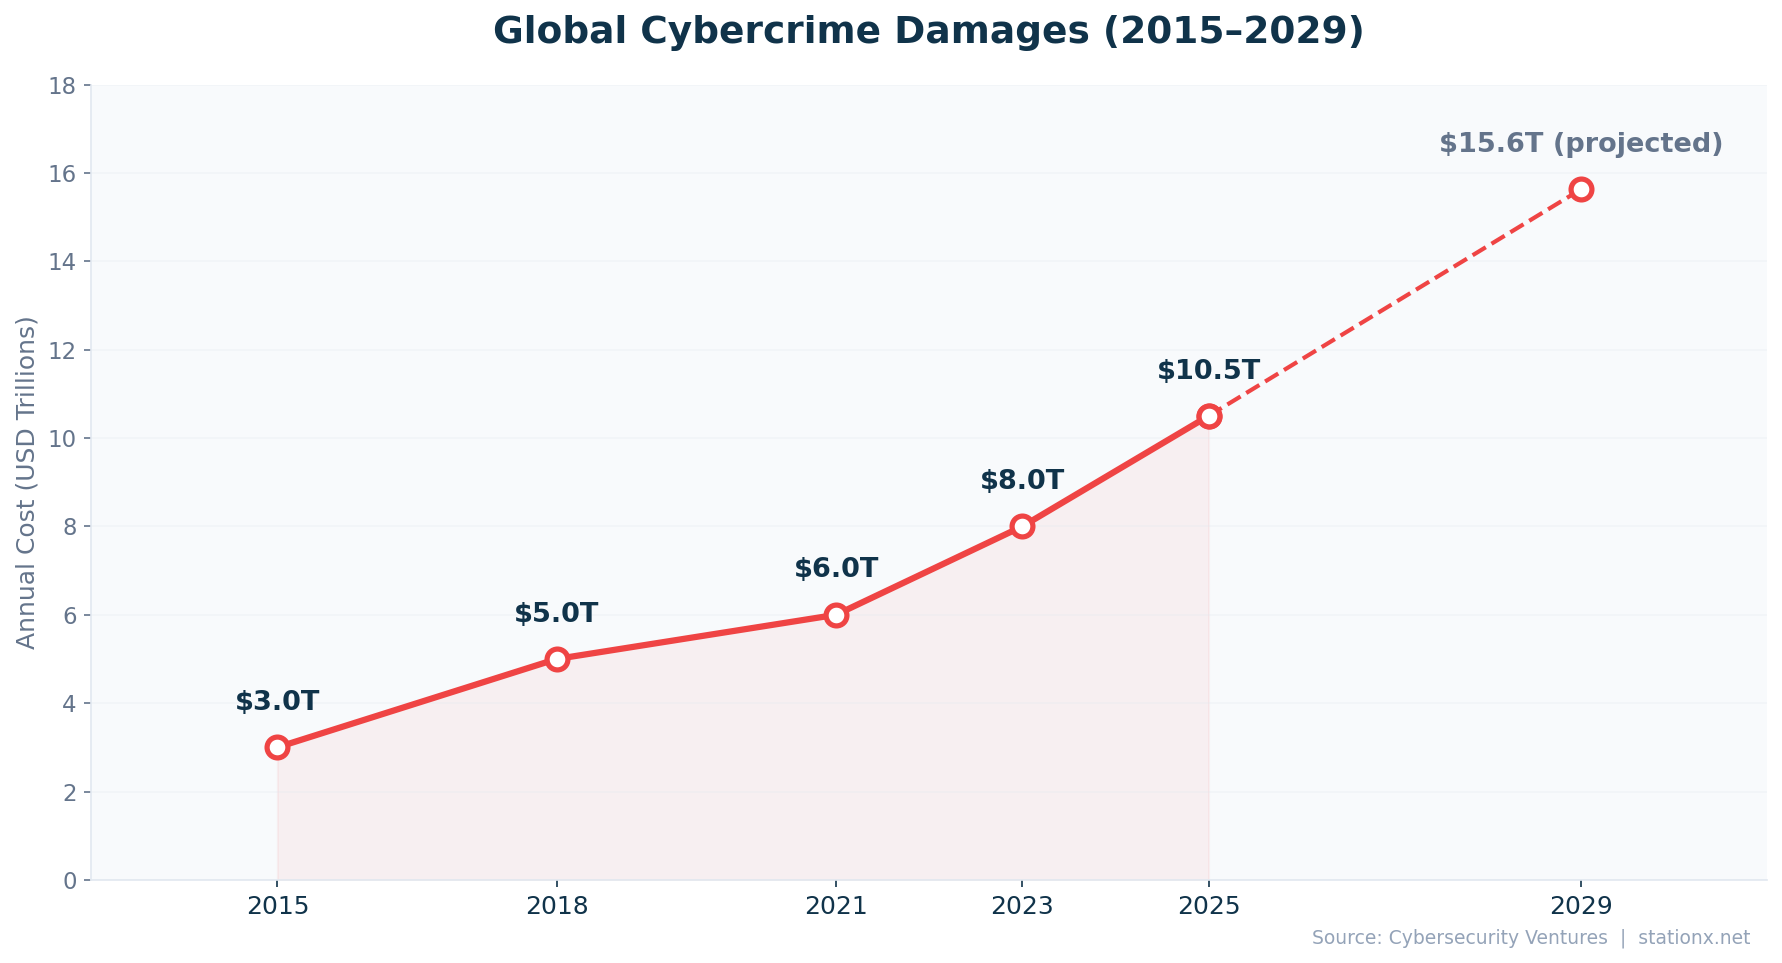
$10.5 trillion. That is the annual global cost of cybercrime in 2026, a figure projected to reach $15.63 trillion by 2029 (Cybersecurity Ventures). The FBI's Internet Crime Complaint Center reported $16.6 billion in losses for 2024 alone, a 33% jump from $12.5 billion the previous year (FBI IC3 2024). Organizations face an attack every 39 seconds, and 95% of breaches are financially motivated (Verizon DBIR 2025).
If cybercrime were measured as a country, its $10.5 trillion economy would rank third globally, behind only the United States ($27T GDP) and China ($18T GDP). The scope of the problem is accelerating: weekly cyberattacks on organizations continue to rise (VikingCloud 2026), US data breaches hit a record 3,322 (Barracuda 2025), and Microsoft processes 600 million+ password attacks per day. Meanwhile, the probability of detecting and prosecuting a cybercrime entity in the US remains a mere 0.05% (WEF 2025).
| Finding | Value | Source |
|---|---|---|
| Global cybercrime damages annually | $10.5T | Cybersecurity Ventures |
| Projected global cybercrime cost by 2029 | $15.63T | Cybersecurity Ventures |
| Global average data breach cost | $4.44M | IBM Cost of a Data Breach Report 2025 |
| Global average breach cost (2024 comparison) | $4.88M | IBM Cost of a Data Breach Report 2024 |
| Ransomware present in breaches | 44% | Verizon DBIR 2025 |
| Time between cyberattacks | 39 seconds | Cobalt / University of Maryland |
| FBI IC3 reported losses (2024) | $16.6B | FBI Internet Crime Report 2024 |
| FBI IC3 reported losses (2023) | $12.5B | FBI Internet Crime Report 2023 |
| Cybercrime victims per hour | 97 | AAG IT / FBI IC3 |
| Chance of detecting/prosecuting cybercrime | 0.05% | WEF Global Cybersecurity Outlook 2025 |
| Breaches involving human element | 68% | Verizon DBIR 2025 |
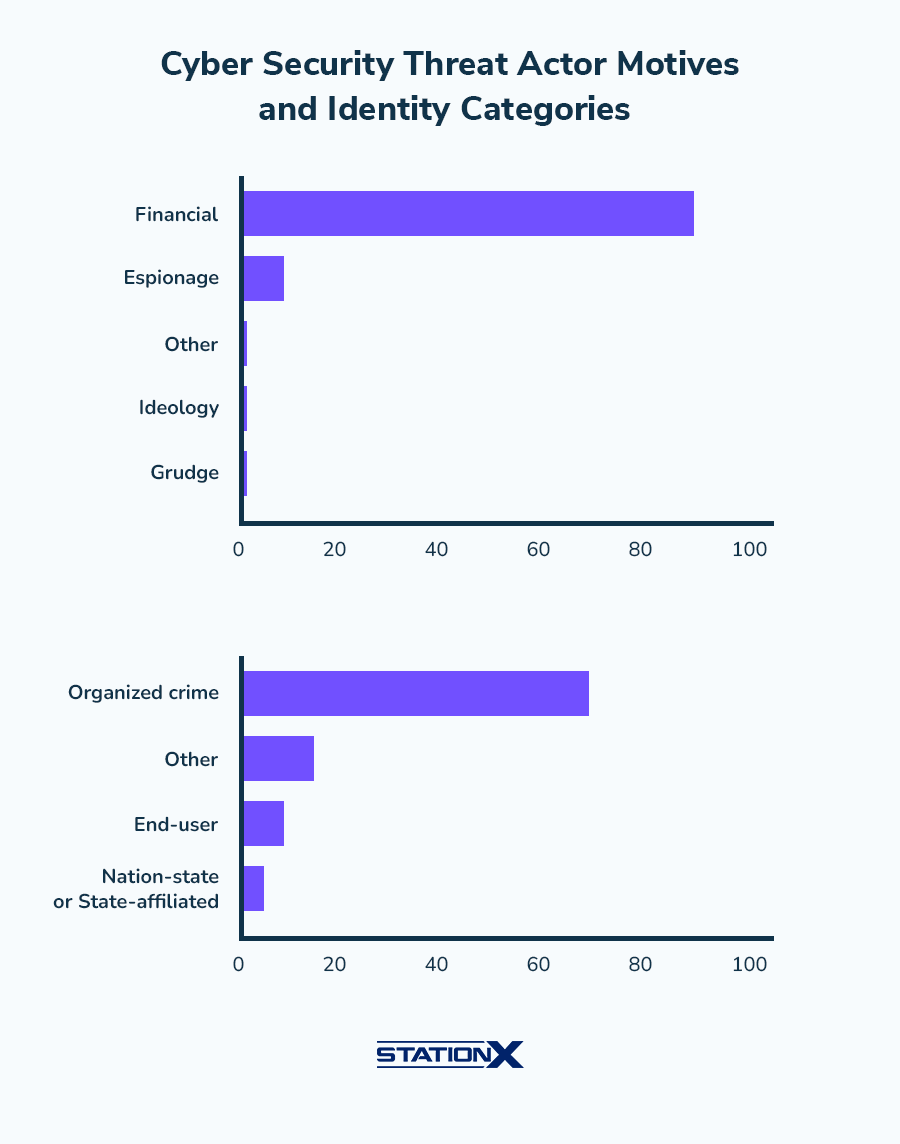
| Breaches with financial motive | 95% | Verizon DBIR 2025 |
| Microsoft: password attacks per day | 600 million+ | Microsoft Digital Defense Report 2024 |
| Weekly cyberattacks on organizations | 1,968 | VikingCloud / Check Point Research |
| US data breaches (record high) | 3,322 | Barracuda Networks / ITRC |
| Attacks with financial motive | ~90% | Verizon DBIR 2024 |
| Attacks by organized crime | ~70% | Verizon DBIR 2024 |
The Scale of Cybercrime
At $10.5 trillion annually, cybercrime costs approximately $20.0M per minute, or $333K per second. That makes cybercrime more profitable than the global illegal drug trade. (Cybersecurity Ventures)
Record FBI Losses
FBI IC3 reported losses surged +32.8% in a single year ($12.5B to $16.6B). Investment fraud was the largest category at $6.57B, followed by BEC at $2.77B. (FBI Internet Crime Report 2023, FBI Internet Crime Report 2024)
💰 Data Breach Costs (IBM 2025 vs 2026)
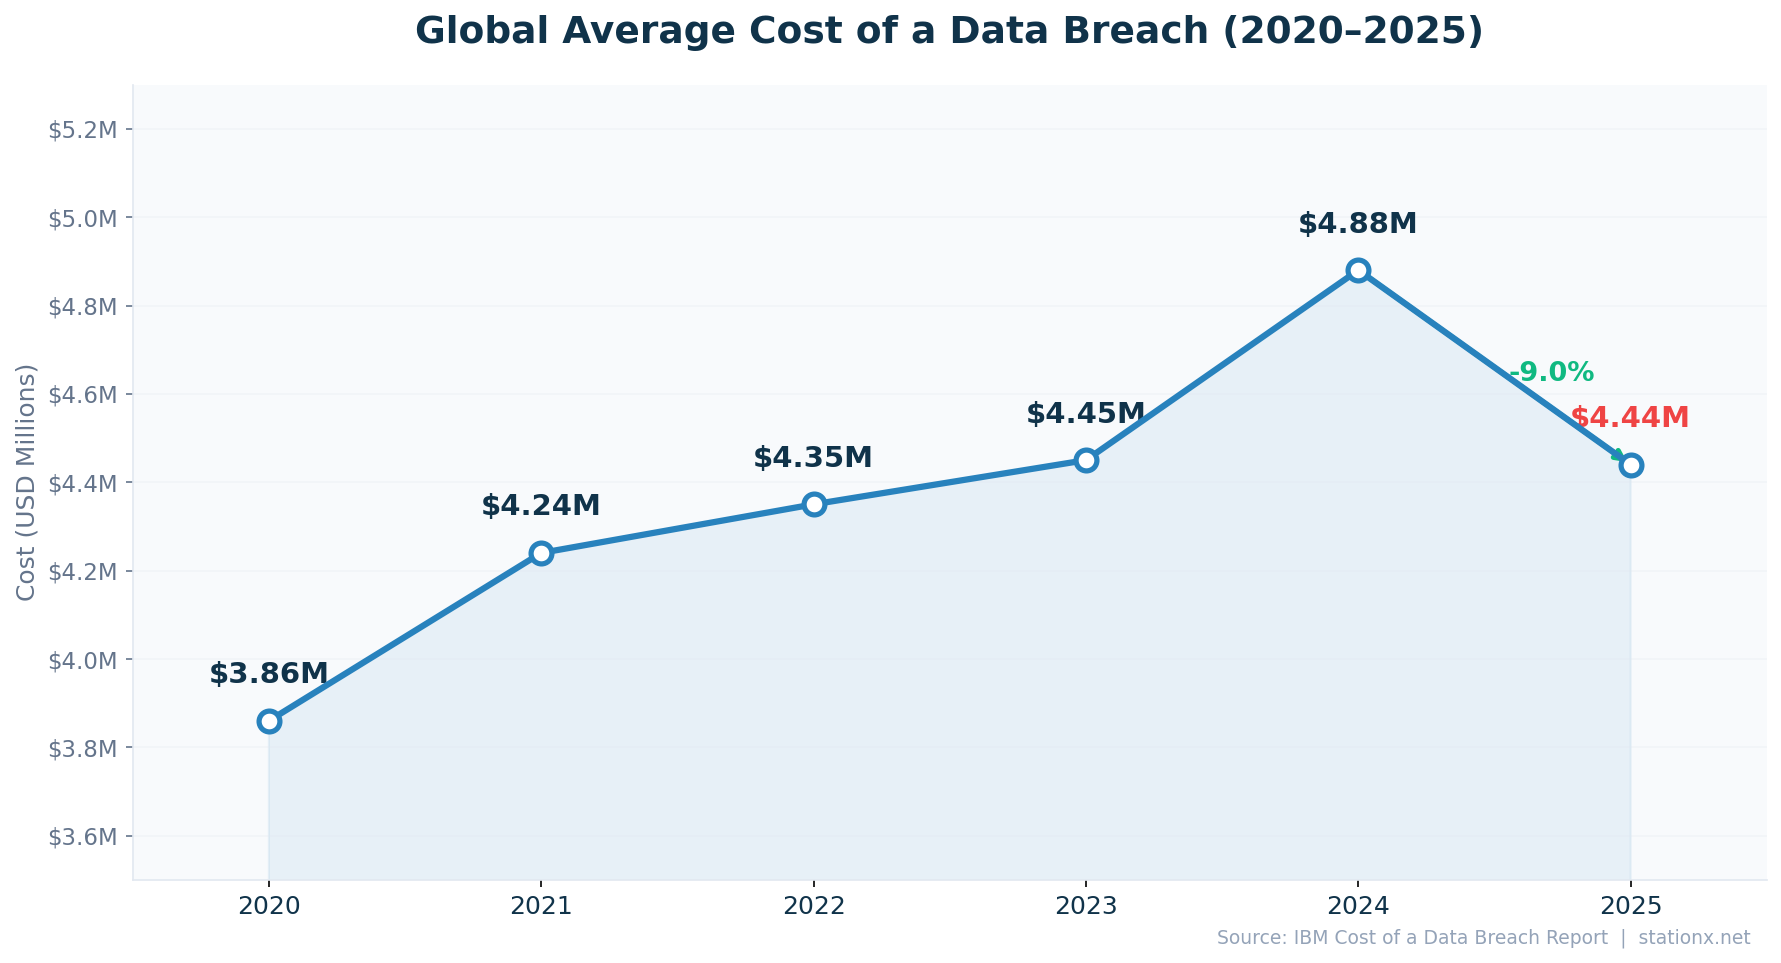
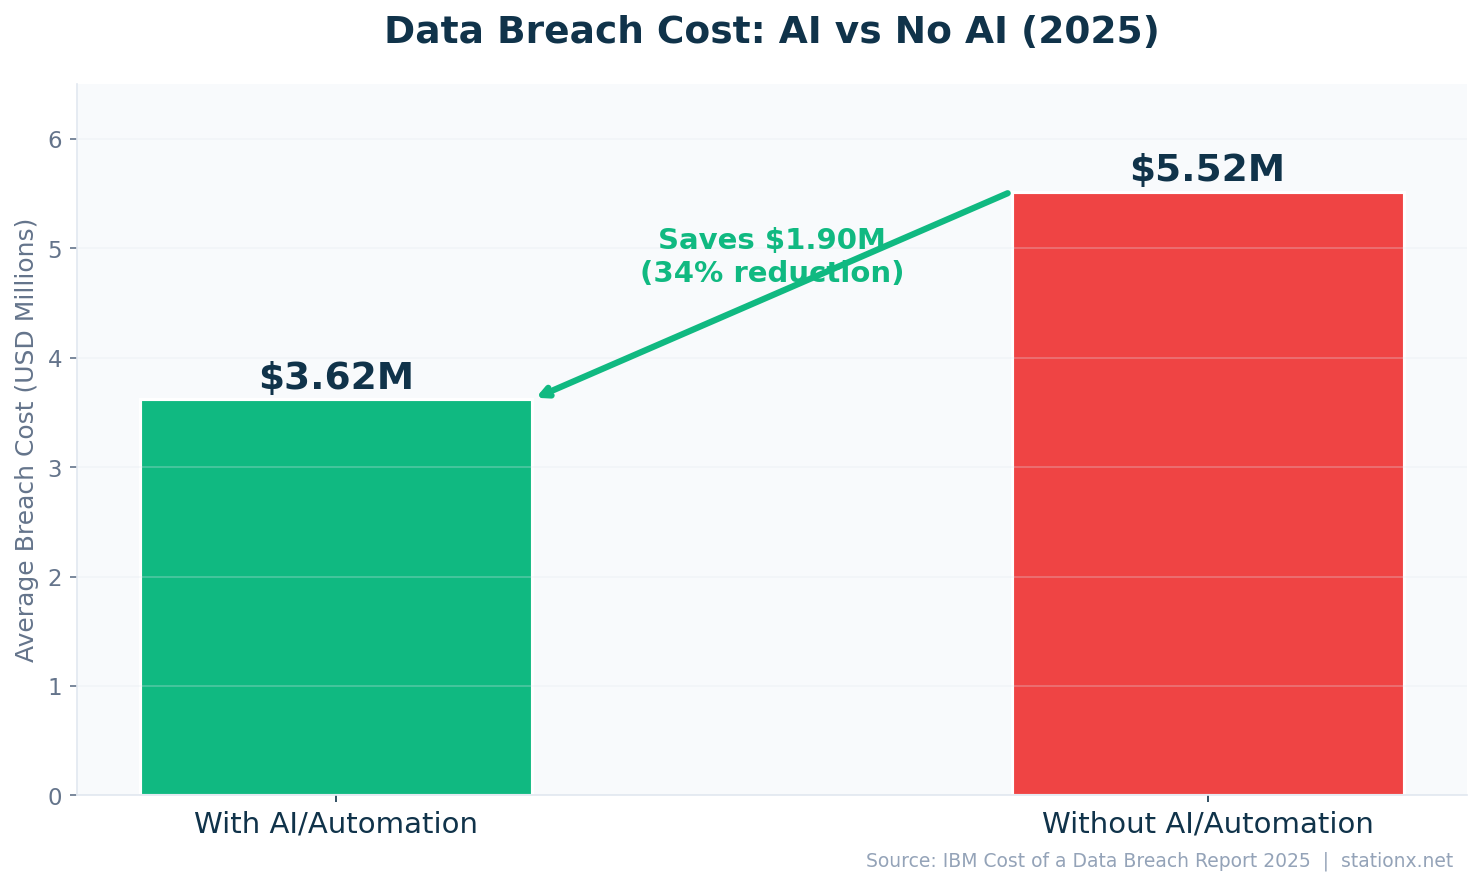
The global average cost of a data breach dropped to $4.44 million in 2025, down 9% from $4.88 million in 2024 (IBM). The decline is largely attributed to widespread adoption of security AI and automation, which saved an average of $1.9 million per breach. Organizations using extensive AI detected breaches 51 days faster and paid $3.62 million per breach versus $5.52 million without AI (IBM 2025).
The average breach lifecycle stands at 241 days (181 days to identify, 60 days to contain). Third-party breaches doubled year-over-year to 30% of all incidents, and supply-chain compromises cost $4.91 million on average. Breaches involving stolen credentials remained the most common vector at 53% of incidents (Verizon DBIR 2025).
| Finding | Value | Source |
|---|---|---|
| Global average breach cost (2025) | $4.44M | IBM Cost of a Data Breach Report 2025 |
| Global average breach cost (2024) | $4.88M | IBM Cost of a Data Breach Report 2024 |
| Average cost per compromised record | $160 | IBM Cost of a Data Breach Report 2025 |
| Average breach lifecycle (identify + contain) | 241 days | IBM Cost of a Data Breach Report 2025 |
| Average time to identify a breach | 181 days | IBM Cost of a Data Breach Report 2025 |
| Average days to contain a breach | 60 days | IBM Cost of a Data Breach Report 2025 |
| Cost savings from security AI/automation | $1.9M | IBM Cost of a Data Breach Report 2025 |
| Breach cost reduction from security AI | 34% | IBM Cost of a Data Breach Report 2025 |
| Breach cost without AI/automation | $5.52M | IBM Cost of a Data Breach Report 2025 |
| Breach cost with extensive AI/automation | $3.62M | IBM Cost of a Data Breach Report 2025 |
| Ransomware/extortion breach cost | $5.08M | IBM Cost of a Data Breach Report 2025 |
| Breach cost from stolen credentials | $4.81M | IBM Cost of a Data Breach Report 2025 |
| Breaches involving third parties | 30% | IBM Cost of a Data Breach Report 2025 |
| Average supply-chain breach cost | $4.91M | IBM Cost of a Data Breach Report 2025 |
| Breach cost when lifecycle > 200 days | $5.01M | IBM Cost of a Data Breach Report 2025 |
| Breach cost with fast resolution (< 200 days) | $3.87M | IBM Cost of a Data Breach Report 2025 |
| Breaches involving human element | 68% | Verizon DBIR 2025 |
| Breaches caused by human error | 88% | Stanford University |
| Breaches caused by external actors | 70% | Verizon DBIR 2025 |
| Lost business cost from breach disruption | 70% | IBM Cost of a Data Breach Report 2024 |
First Decline in Four Years
Data breach costs fell -9.0% year-over-year ($4.88M in 2024 to $4.44M in 2025). IBM attributes the drop to increased AI/automation adoption in security operations. (IBM Cost of a Data Breach Report 2024, IBM Cost of a Data Breach Report 2025)
The AI Security Dividend
Organizations with extensive AI/automation save $1.9M per breach ($3.62M vs $5.52M without). Detection drops from 72 days to 51 days with extensive AI use. (IBM Cost of a Data Breach Report 2025)
Breach Cost by Attack Vector
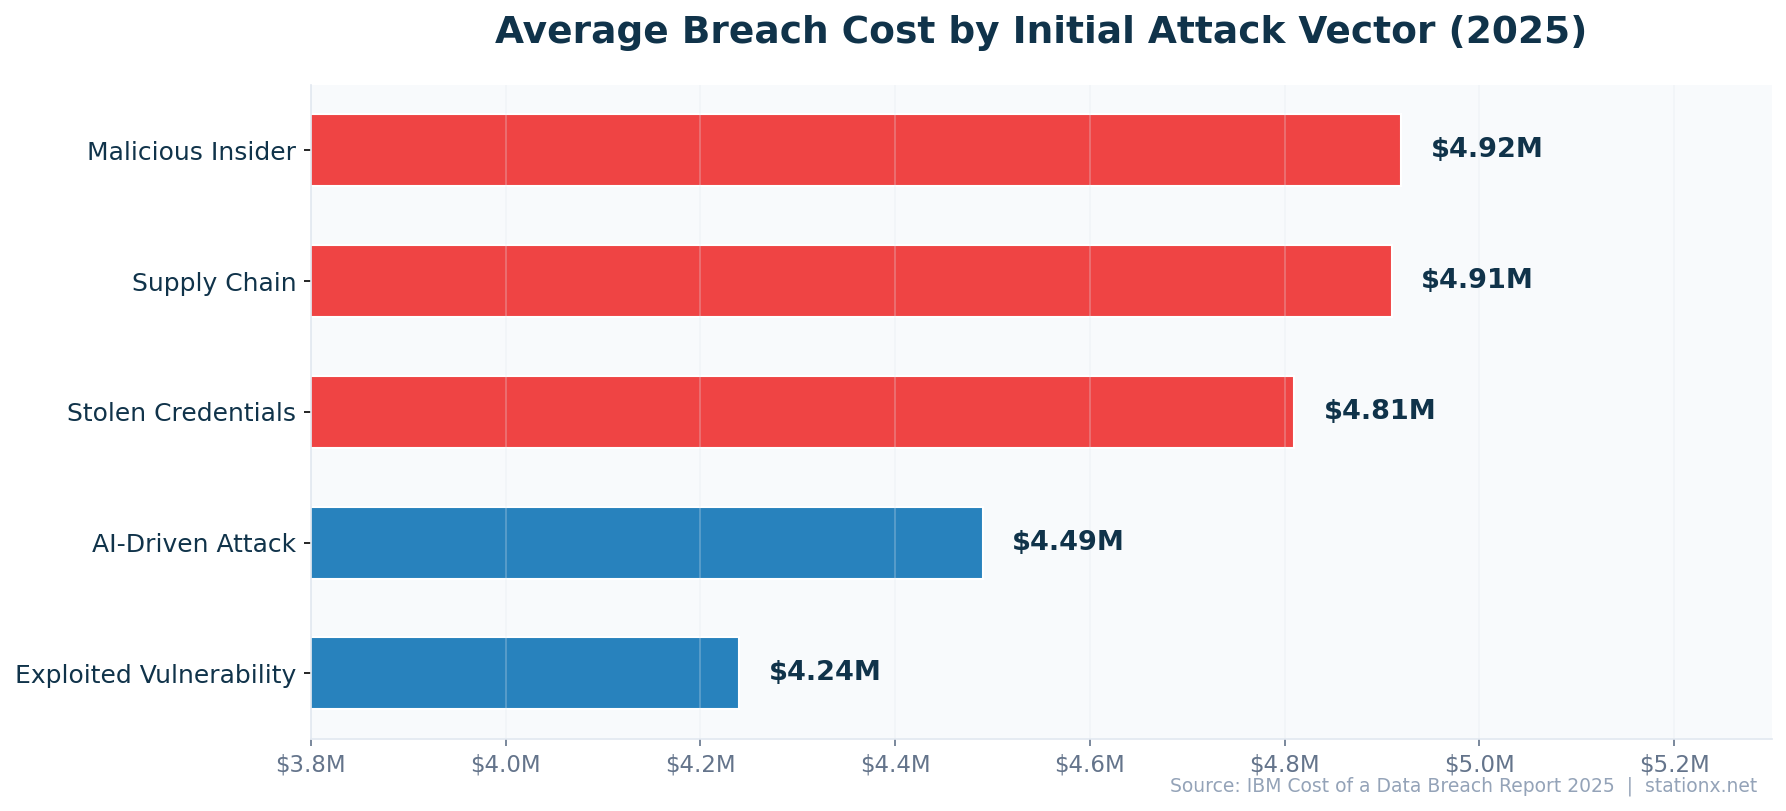
Ransomware/extortion is the most expensive initial attack vector at $5.08 million per breach, followed by supply chain compromise at $4.91 million and stolen credentials at $4.81 million (IBM 2025). Phishing accounts for 16% of all breaches as an initial vector.
Breaches that take longer than 200 days to resolve cost substantially more than those resolved quickly (IBM 2025). Organizations with an incident response plan save significantly on breach costs. External actors cause the majority of breaches, but third-party supply chain compromises doubled year-over-year to 30% (IBM 2025). The lesson: detection speed and supply chain governance are the two highest-leverage cost reduction strategies.
| Finding | Value | Source |
|---|---|---|
| Phishing as initial attack vector | 16% | IBM Cost of a Data Breach Report 2025 |
| Stolen/compromised credentials | $4.81M | IBM Cost of a Data Breach Report 2025 |
| Ransomware/extortion attacks | $5.08M | IBM Cost of a Data Breach Report 2025 |
| Supply chain compromise | $4.91M | IBM Cost of a Data Breach Report 2025 |
| Exploited vulnerability | $4.24M | IBM Cost of a Data Breach Report 2025 |
Most Expensive Attack Vectors
Attack vector cost ranking: Average breach cost from malicious insider attacks: $4.92M, Average supply-chain breach cost: $4.91M, Average breach cost from stolen/compromised credentials: $4.81M, Average breach cost from AI-driven attacks: $4.49M, Average breach cost from exploited vulnerability: $4.24M. (IBM Cost of a Data Breach Report 2025)
What Would a Breach Cost Your Organisation?
Adjust the inputs below to estimate your breach cost based on IBM Cost of a Data Breach 2025 data.
🌍 Breach Costs by Country (9 Countries Ranked)
Country Data Explorer
Select a country to explore its cybersecurity landscape.
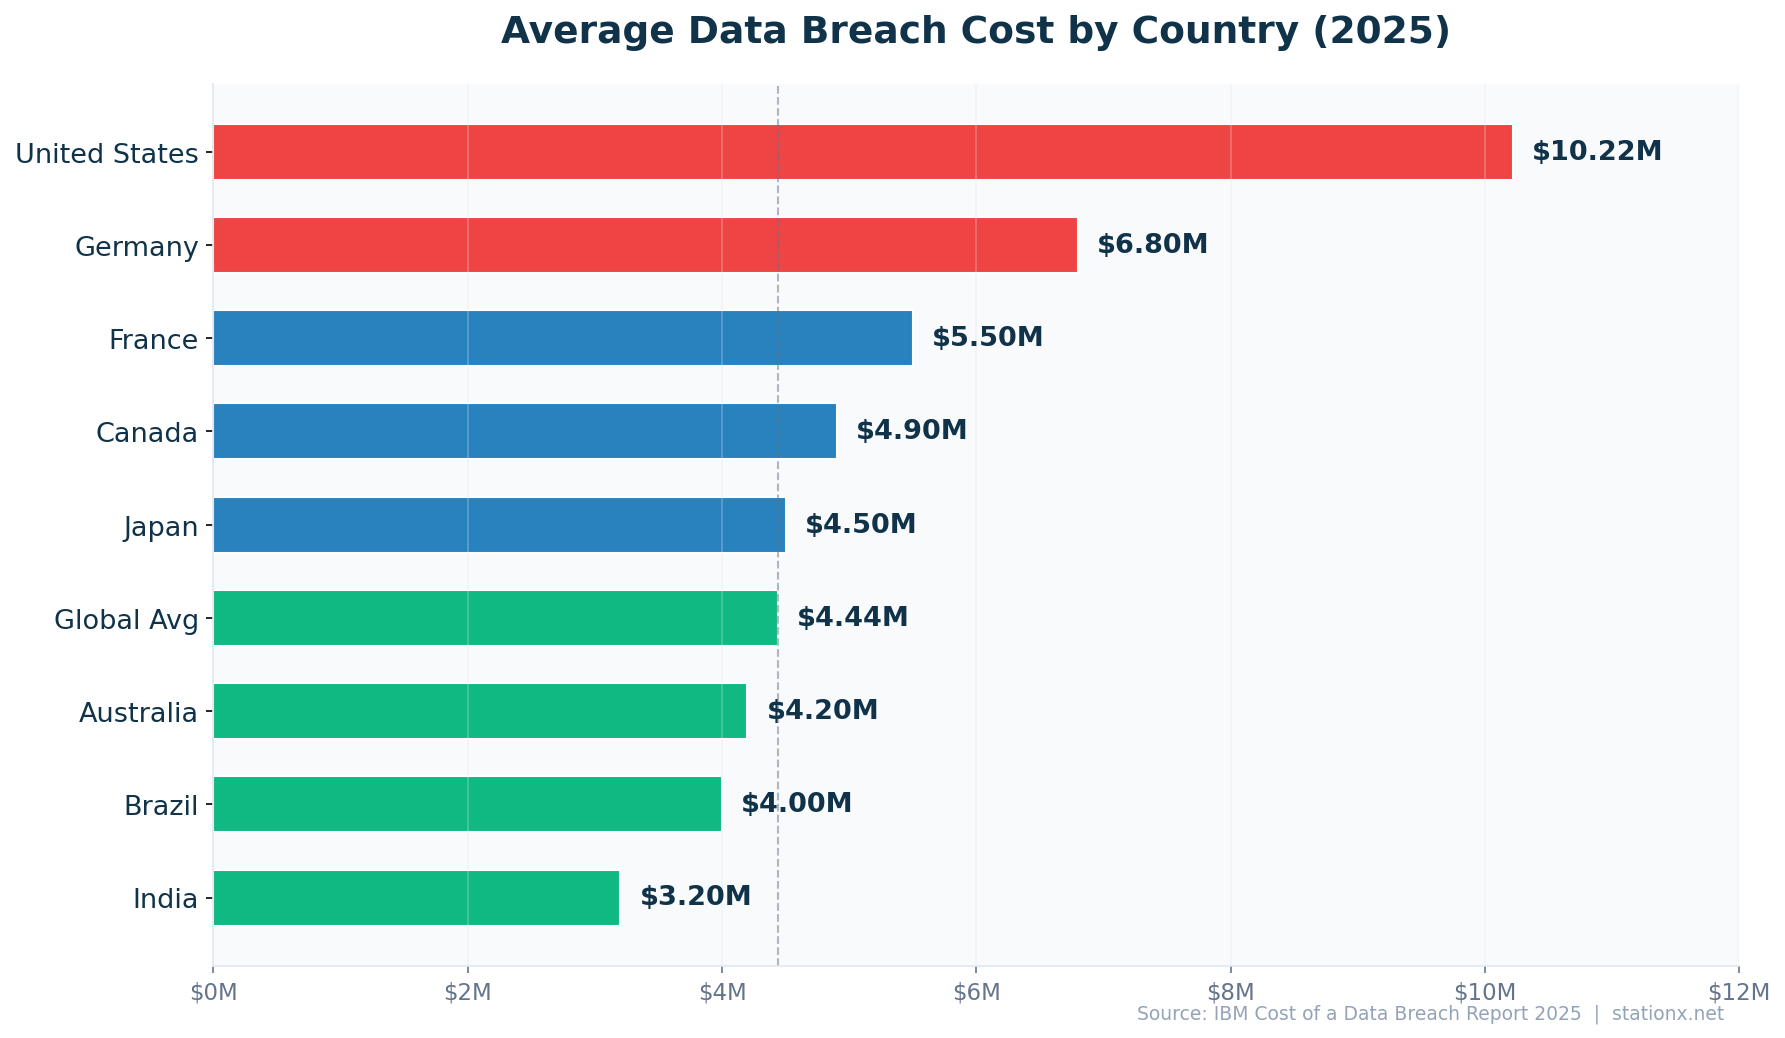
The United States leads all countries at $10.22 million per breach, an all-time high and 2.3x the global average. Germany ($6.8M) and France ($5.5M) follow. India ($3.2M) has the lowest cost among tracked nations but also the fastest-growing attack volume with a 24% rise in ransomware (IBM 2025, CERT-In).
| Finding | Value | Source |
|---|---|---|
| United States | $10.22M | IBM Cost of a Data Breach Report 2025 |
| Germany | $4.03M | IBM Cost of a Data Breach Report 2025 |
| France | $3.73M | IBM Cost of a Data Breach Report 2025 |
| Canada | $4.84M | IBM Cost of a Data Breach Report 2025 |
| Japan | $3.65M | IBM Cost of a Data Breach Report 2025 |
| Australia | $2.55M | IBM Cost of a Data Breach Report 2025 |
| Brazil | $1.22M | IBM Cost of a Data Breach Report 2025 |
| India | $2.51M | IBM Cost of a Data Breach Report 2025 |
| Global Average | $4.44M | IBM Cost of a Data Breach Report 2025 |
3.2x Cost Gap Between Countries
Breach costs range $10.22M (US) to $1.22M (India). The US leads at 2.3x the global average, while India faces the cheapest breaches but the highest attack frequency. (IBM Cost of a Data Breach Report 2025)
Several factors explain the US cost premium: stricter notification requirements, higher litigation costs, larger regulatory fines, and costlier incident response. Germany and France benefit from stronger baseline GDPR compliance but still face rising costs. In APAC, Japan ($4.5M) and Australia ($4.2M) have converged toward the global mean, while India ($3.2M) and Brazil ($4.0M) remain below average but are growing rapidly in attack volume.
Organizations operating across multiple jurisdictions face compounding costs from overlapping regulatory regimes. A breach affecting EU citizens triggers GDPR notification requirements within 72 hours, while US state-level breach notification laws create a patchwork of obligations. For multinational enterprises, a single breach can trigger compliance costs across 5-10 regulatory frameworks simultaneously.
🔒 Ransomware Trends
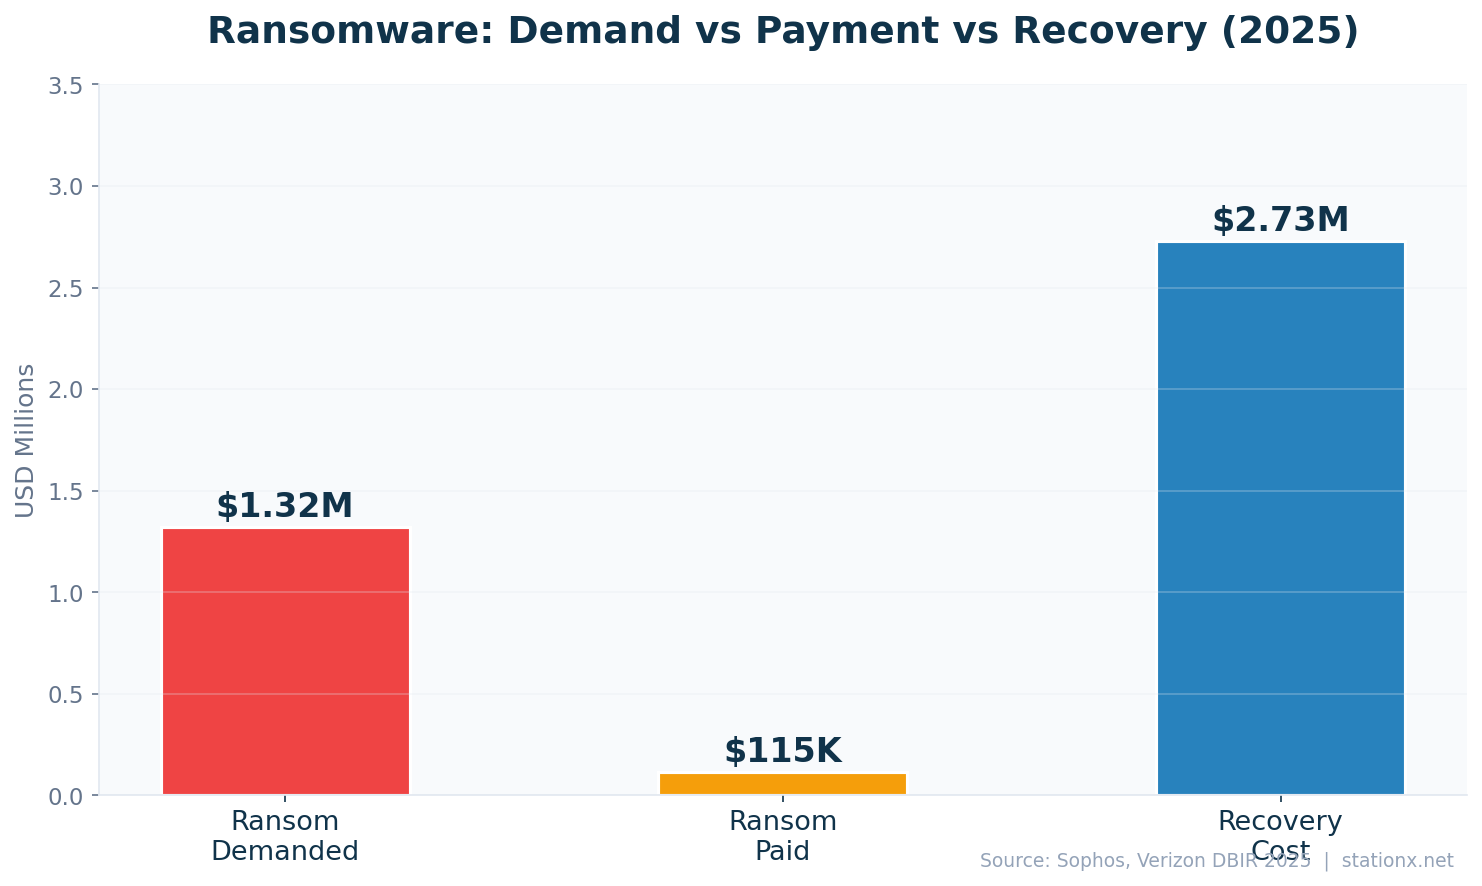
Ransomware is present in 44% of all data breaches, up from 32% the prior year (Verizon DBIR 2025). Attack volume surged 58% in 2025 (HIPAA Journal). Global ransomware damages are estimated at $57 billion annually, with daily damage reaching $156 million (Cybersecurity Ventures). The median ransom payment is $115,000, but 64% of organizations now refuse to pay (Verizon DBIR 2025).
Double extortion (data exfiltration plus encryption) is now the norm at 87.6% of ransomware claims (Travelers Insurance). Recovery takes a median of 100+ days (Sophos 2024), and the mean recovery cost excluding the ransom is $2.73 million (Sophos 2025). 55 new ransomware-as-a-service families emerged in 2024, a 67% increase (Travelers).
| Finding | Value | Source |
|---|---|---|
| Ransomware present in breaches | 44% | Verizon DBIR 2025 |
| Increase in ransomware attacks (2025) | 58% | HIPAA Journal |
| Global ransomware damages (2025) | $57B | Cybersecurity Ventures |
| Projected ransomware damages by 2031 | $265B | Cybersecurity Ventures |
| Daily ransomware damage | $156M | Cybersecurity Ventures |
| Average cost of a ransomware attack | $1.85M | Sophos State of Ransomware 2024 |
| Organizations hit by ransomware (2024) | 73% | Fortinet State of Cybersecurity 2024 |
| Median ransom payment | $115,000 | Verizon DBIR 2025 |
| Median ransom demand | $1.32M | Sophos State of Ransomware 2025 |
| Average ransom demand | $2M | Industry surveys 2025 |
| Total crypto ransom payments (2024) | $813M | Chainalysis |
| Organizations refusing to pay ransom | 64% | Verizon DBIR 2025 |
| Ransomware with data exfiltration | 87.6% | Travelers Insurance Claims Data |
| Median recovery time from ransomware | 100+ days | Sophos State of Ransomware 2024 |
| Mean recovery cost (excl. ransom) | $2.73M | Sophos State of Ransomware 2024 |
| Mean global recovery cost (2025) | $1.53M | Sophos State of Ransomware 2025 |
| Organizations recovering all data after paying | 97% | Sophos State of Ransomware 2025 |
| New RaaS families identified (2024) | 55 | Travelers Insurance |
| Active ransomware gangs tracked | 95 | Halcyon |
| Ransomware victims per day | 15 | Halcyon |
| Victims paying within 48 hours | 75% | Halcyon |
| Backup repositories targeted in attacks | 96% | Veeam Ransomware Trends Report 2024 |
| Backups surviving ransomware attack | 76% | Veeam Ransomware Trends Report 2024 |
| Attacked again after paying ransom | 80% | Fortinet State of Ransomware 2024 |
| Organizations laying off staff post-ransomware | 40% | Fortinet State of Ransomware 2024 |
| Savings involving law enforcement | $990K savings | IBM Cost of a Data Breach Report 2025 |
| Largest single ransom payment (2024) | $75M | Mandiant M-Trends 2024 |
| Ransomware in SMB breaches | 88% | Verizon DBIR 2025 |
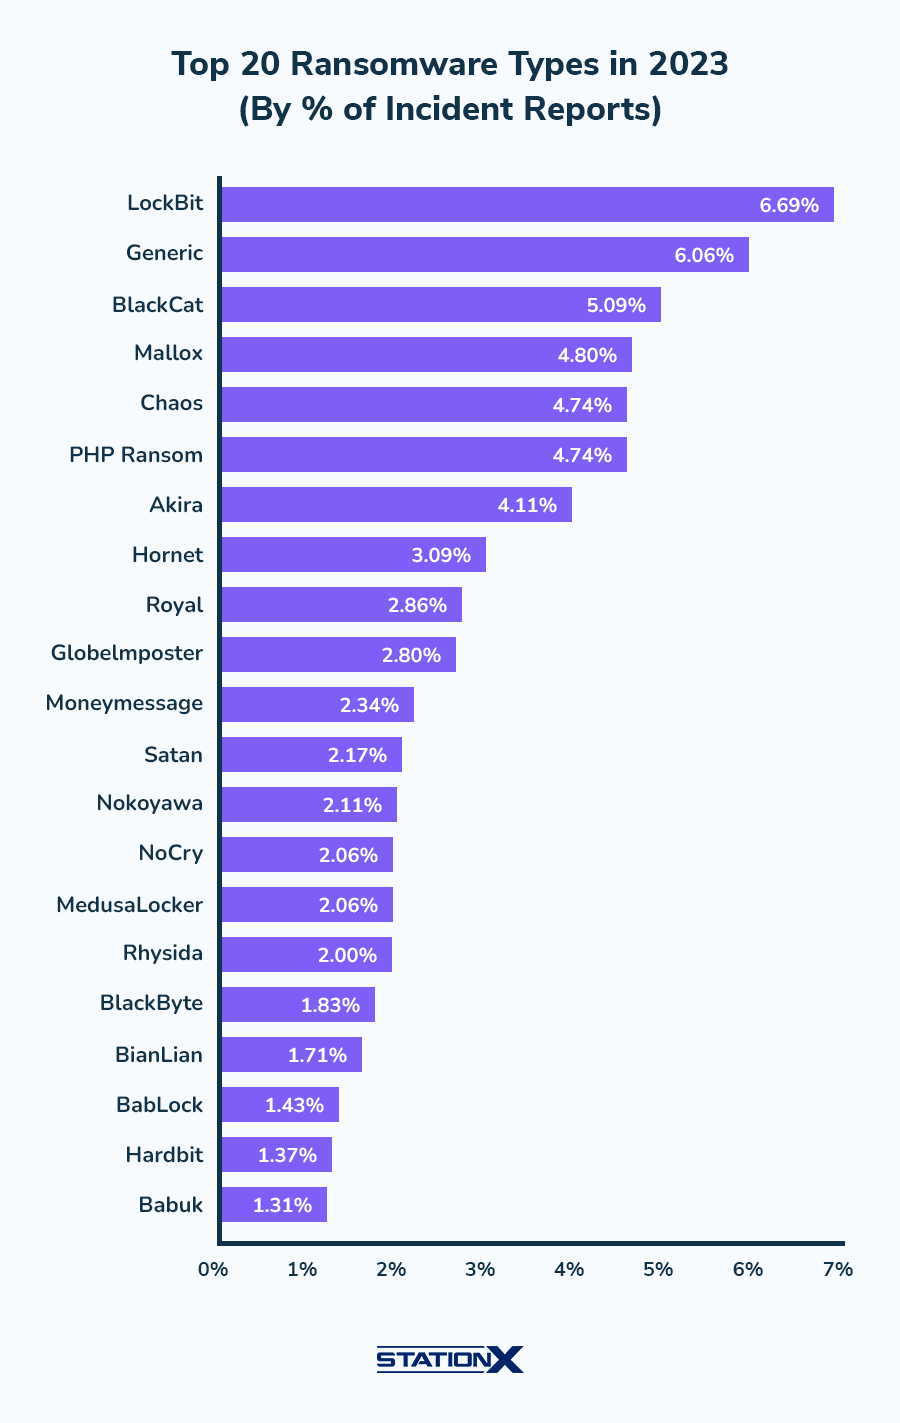
| LockBit share of incidents (top variant) | 6.69% | Industry Reports |
Multi-Source Confirmation
3 independent sources confirm ransomware growth: 44%, 58%, 73%. When independent sources agree, the trend is real. (Verizon DBIR 2025, HIPAA Journal, Fortinet State of Cybersecurity 2024)
Victims Negotiate Hard
Victims pay 0.1x of the demanded ransom (median $115K paid vs $1.32M demanded). 64% of organisations now refuse to pay entirely, up from 41% two years ago. (Verizon DBIR 2025, Sophos State of Ransomware 2025)
The economics of ransomware heavily favor attackers. The largest single ransom payment in 2024 was $75 million to Dark Angels (ThreatLabZ). Meanwhile, 67% of organizations that paid a ransom were targeted again within 12 months (Fortinet 2024), and layoffs following a ransomware attack affect a significant portion of victim organizations. Backup compromise rates exceed 90% in targeted attacks (Veeam 2024), which explains why organizations paying the ransom often fail to recover all data (Sophos 2025).
Law enforcement involvement makes a measurable difference. IBM reports that organizations involving law enforcement saved on average compared to those handling incidents alone. 64% of organizations now refuse to pay ransom demands (Verizon DBIR 2025), a shift driven by better backups, insurance requirements, and government guidance discouraging payments.
🎣 Phishing & Social Engineering
3.4 billion phishing emails flood inboxes every day. Phishing remains the most common initial attack vector, appearing in 16% of breaches (IBM 2025). AI-generated phishing emails now match or exceed human-crafted ones in effectiveness, with 40% of Q2 BEC emails identified as AI-generated (VIPRE 2024). The median time from email delivery to click is just 21 seconds (Verizon DBIR 2025).
FBI IC3 received 193,407 phishing complaints in 2024. Business email compromise (BEC) losses hit $2.9 billion (FBI IC3). Vishing attacks surged dramatically in 2025 (CrowdStrike), and smishing now accounts for a significant share of mobile-based attacks. Social engineering accounts for 98% of all cyberattacks when combined across vectors (Sprinto).
Phishing Statistics
| Finding | Value | Source |
|---|---|---|
| Phishing emails sent daily | 3.4 billion | AAG IT / industry data |
| Phishing attacks reported annually | 3.8 million | APWG Phishing Activity Trends |
| Phishing scams reported (Q4 2024) | 989,123 | APWG Phishing Activity Trends Q4 2024 |
| Phishing attacks (Q2 2025) | 1,130,393 | APWG Phishing Activity Trends Q2 2025 |
| Phishing in data breaches | 36% | Verizon DBIR 2025 |
| Phishing as initial breach vector | 16% | IBM Cost of a Data Breach Report 2025 |
| Median time to click phishing link | 21 seconds | Verizon DBIR 2025 |
| Users who click phishing links | 2.7% | Verizon DBIR 2025 |
| Median time to report phishing | 28 minutes | Verizon DBIR 2025 |
| FBI IC3 phishing complaints (2024) | 193,407 | FBI Internet Crime Report 2024 |
| AI-generated phishing success rate vs human | 82.6% | Keepnet Labs / VIPRE Security Group |
| AI phishing click-through rate | 54% | Harvard Business Review / Heiding, Schneier et al. |
| AI phishing cost reduction vs manual | 95%+ | Harvard Business Review / Heiding, Schneier et al. |
| BEC emails that were AI-generated | 40% | VIPRE Security Group Q2 2024 |
| Average phishing site lifespan | 12 hours | BlackBerry Global Threat Intelligence 2025 |
| Phishing websites detected (2025) | 80,000+ | Group-IB 2025 |
| Global phishing losses | $25B | CDNetworks / SentinelOne |
| Smishing share of mobile attacks | 35% | SentinelOne / Industry Reports |
| Malspam using links vs attachments | 86% | VIPRE Security Group Q2 2024 |
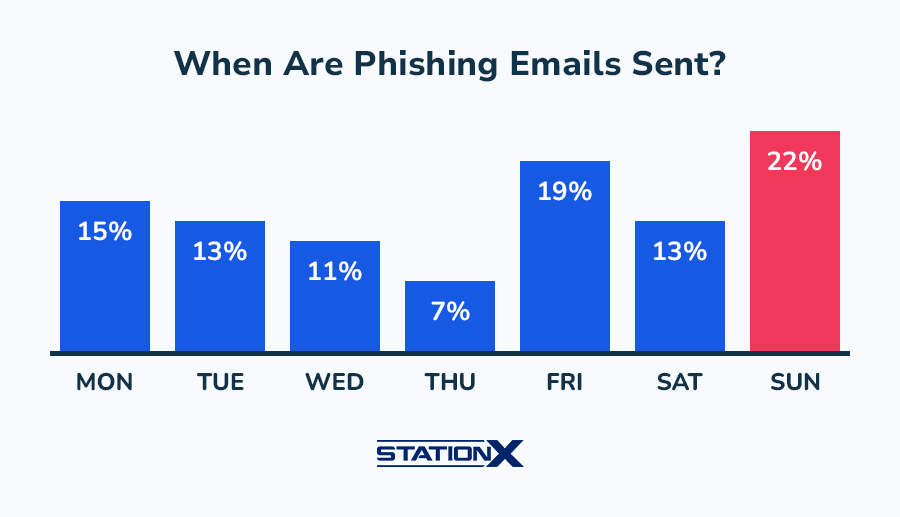
| Phishing emails peak on Sundays | 22% | StationX / Industry data |
| Phishing emails on Fridays (2nd highest) | 19% | StationX / Industry data |
92 Million Clicks Per Day
3.4 billion daily phishing emails × 2.7% click rate = approximately 91.8M successful phishing clicks per day. Each click is a potential breach entry point. (AAG IT / industry data, Verizon DBIR 2025)
Social Engineering & BEC
Business email compromise (BEC) remains one of the costliest attack types despite requiring minimal technical sophistication. FBI IC3 BEC losses hit $2.9 billion in 2023 (FBI IC3). BEC attacks increasingly use AI-generated content, with 40% of BEC emails in Q2 2024 identified as AI-crafted (VIPRE). Average BEC losses per incident are substantial, and organizations without phishing-resistant MFA face dramatically higher compromise rates (Arctic Wolf 2025).
Vishing (voice phishing) surged in 2025 (CrowdStrike), driven by AI voice cloning that can replicate a person's voice from just 3 seconds of audio (McAfee 2024). Smishing (SMS phishing) now accounts for a growing share of mobile-based attacks (SentinelOne 2026). The convergence of AI-generated text, voice, and video across phishing, vishing, and smishing creates a multi-channel social engineering threat that traditional email-only defenses cannot address.
| Finding | Value | Source |
|---|---|---|
| Orgs citing phishing/social eng as top risk | 42% | WEF Global Cybersecurity Outlook 2025 |
| Vishing attacks surge (2025) | 442% | CrowdStrike 2025 Global Threat Report |
| Voice phishing increase YoY | 442% | CrowdStrike 2025 Global Threat Report |
| Attack emails originating from social eng | 68% | KnowBe4 Financial Sector Threats Report 2025 |
| FBI BEC losses (2024) | $2.77B | FBI Internet Crime Report 2024 |
| FBI BEC losses (2023) | $2.9B | FBI Internet Crime Report 2023 |
| Average BEC attack cost | $4.67M | IBM / HoxHunt |
| BEC share of financially motivated breaches | 58% | Verizon DBIR 2025 |
| BEC share of all incidents | 27% | Arctic Wolf Threat Report 2025 |
| Average BEC loss per incident | $160,000+ | Arctic Wolf Threat Report 2025 |
| Social eng share of all attacks | 98% | Sprinto / Purplesec |
| AI-crafted phishing share | 80%+ | Abnormal Security / Xceedance |
| Pretexting share of social eng attacks | 50%+ | Verizon DBIR 2025 |
| Smishing/vishing breaches | 19% | Verizon DBIR 2025 |
| Social eng as primary attack vector | 42% | SentinelOne / Industry Reports |
| Social eng share of all threats (Q1 2024) | 90% | Avast Q1 2024 Threat Report |
| Identity-based phishing incidents | 60% | Cisco Cybersecurity Readiness Index 2025 |
| BEC volume surge (H1 2025) | 54% | Abnormal Security |
| Smishing surge (2025) | 40% | APWG / Keepnet |
🤖 AI-Powered Cyber Threats
AI is reshaping both sides of the cybersecurity battlefield. 66% of organizations expect AI to have the most significant impact on cybersecurity this year (WEF 2025). Shadow AI (unauthorized AI tool usage) is a growing breach vector, adding extra cost to breaches and exposing PII at scale (IBM 2025). Security teams adopting AI tools see 34% lower breach costs and 51 days faster detection.
On the offensive side, AI-generated phishing reduces attack costs by 95% while maintaining high click-through rates (HBR 2024). Deepfake fraud surged in 2024, with the largest deepfake-enabled CFO scam reaching $25 million (CrowdStrike). Gartner projects that GenAI will cause a significant rise in cyberattacks by 2027. Meanwhile, organizations lacking AI governance frameworks remain exposed to model manipulation and data poisoning attacks.
AI Threat Landscape
| Finding | Value | Source |
|---|---|---|
| Orgs citing AI as primary cyber concern | 47% | WEF Global Cybersecurity Outlook 2025 |
| Orgs saying AI will impact cybersecurity | 66% | WEF Global Cybersecurity Outlook 2025 |
| Breaches involving shadow AI | 20% | IBM Cost of a Data Breach Report 2025 |
| Extra breach cost from shadow AI | $670K | IBM Cost of a Data Breach Report 2025 |
| Shadow AI PII exposure incidents | 65% | IBM Cost of a Data Breach Report 2025 |
| Breaches involving AI/ML models | 13% | IBM Cost of a Data Breach Report 2025 |
| Orgs lacking AI access controls | 97% | IBM Cost of a Data Breach Report 2025 |
| Orgs with no AI governance framework | 63% | IBM Cost of a Data Breach Report 2025 |
| Orgs with no AI upload controls | 83% | IBM Cost of a Data Breach Report 2025 |
| AI used by attackers in breach campaigns | 16% | IBM Cost of a Data Breach Report 2025 |
| AI phishing as attack method | 37% | IBM Cost of a Data Breach Report 2025 |
| Deepfake as attack method | 35% | IBM Cost of a Data Breach Report 2025 |
| Security teams adopting AI tools | 77% | IBM Cost of a Data Breach Report 2025 |
| Orgs seeing GenAI-related security breaches | 97% | Capgemini Research Institute |
| Orgs experiencing AI attacks | 63% | Bitdefender 2025 Cybersecurity Assessment Report |
| SMBs without formal AI security policy | 51% | ConnectWise State of SMB Cybersecurity 2024 |
| GenAI share of cyberattacks by 2027 | 17% | Gartner |
| AI-enabled attack increase | 47% | SentinelOne |
| AI adversary sophistication increase | 89% | SentinelOne |
| CISOs citing AI as biggest challenge | 53% | SentinelOne / Industry Reports |
| Security teams using AI tools | 75% | Cobalt |
| Orgs where AI demand outpaces capability | 57% | Cobalt |
| WEF: AI as key driver of cyber risk (2026) | 94% | WEF Global Cybersecurity Outlook 2026 |
| WEF: AI vulnerabilities as fastest-growing risk | 87% | WEF Global Cybersecurity Outlook 2026 |
Deepfake & Synthetic Fraud
Deepfake fraud is one of the fastest-growing threat categories. The largest deepfake-enabled scam in 2024 tricked a finance executive into transferring $25 million via a video call with a deepfaked CFO (CrowdStrike). Deepfake fraud incidents surged (Pindrop 2024), and Deloitte projects GenAI-enabled fraud losses will reach substantial levels by 2027. The deepfake detection market is growing rapidly in response, yet both managers and C-suite executives report being unprepared for deepfake-based attacks (WEF 2025).
| Finding | Value | Source |
|---|---|---|
| Deepfake fraud increase | 3,000% | Onfido 2024 Identity Fraud Report |
| Deepfake fraud surge (2024) | 1,300% | Pindrop 2025 Voice Intelligence & Security Report |
| GenAI fraud losses projected by 2027 | $40B | Deloitte Center for Financial Services |
| Deepfake detection accuracy | 0.1% | iProov Deepfake Blindspot Study 2025 |
| Largest deepfake CFO scam (2024) | $25.6M | CrowdStrike 2025 Global Threat Report |
| Managers unprepared for deepfakes | 21% | WEF Global Cybersecurity Outlook 2025 |
| C-suite unprepared for deepfakes | 28% | WEF Global Cybersecurity Outlook 2025 |
| Deepfakes circulating online (2025) | 8 million | DeepStrike |
| People targeted by AI voice scams | 25% | McAfee |
| Audio needed to clone a voice | 3 seconds | McAfee |
| Deepfake detection market (2026) | $15.7B | Deloitte |
| Deepfake video detection rate | 24.5% | DeepStrike / iProov |
| Deepfake AI market size (2025) | $850M | MarketsandMarkets |
🐛 Malware & Threat Landscape
450,000+ new malware samples are detected every day (AV-TEST), bringing the total registered samples to 1.56 billion. 75% of attacks are now malware-free, relying on legitimate tools, stolen credentials, and living-off-the-land techniques (CrowdStrike 2025). SonicWall detected 210,258 never-before-seen malware variants in 2024, an 8% increase.
The eCrime breakout time (time from initial access to lateral movement) dropped to 48 minutes (CrowdStrike 2025). Mobile threats are escalating, with smartphone attacks blocked daily and mobile banking trojans on the rise (Kaspersky 2024). Access broker advertisements on dark web forums continue to grow, enabling less technical actors to launch sophisticated attacks.
Malware Statistics
The shift to malware-free attacks does not mean malware is declining. Rather, attackers now use a dual approach: commodity malware for mass campaigns and living-off-the-land techniques for targeted intrusions. Access brokers on dark web forums sell initial access to compromised networks, enabling even low-skill actors to deploy sophisticated attacks. Mobile malware is a growing vector: banking trojans targeting Android surged (Kaspersky 2024), and mobile-targeted phishing sites reached unprecedented levels (Zimperium 2024).
| Finding | Value | Source |
|---|---|---|
| New malware samples detected daily | 450,000+ | AV-TEST Institute |
| Total malware/PUA samples registered | 1.56 billion | AV-TEST Institute |
| Attacks that are malware-free | 79% | CrowdStrike 2025 Global Threat Report |
| Never-before-seen malware variants (2024) | 210,258 | SonicWall 2025 Cyber Threat Report |
| Cryptojacking incidents (all-time high) | 1.06 billion | SonicWall 2024 Cyber Threat Report |
| Mobile banking trojans detected (2024) | 247,949 | Kaspersky Financial Cyberthreats Report 2024 |
| Smartphone attacks blocked (2024) | 33.3 million | Kaspersky Mobile Threat Report 2024 |
| Crypto phishing attempts (2024) | 10.7 million | Kaspersky Financial Cyberthreats Report 2024 |
| Android Trojan bankers growth | 1.24 million | Kaspersky Mobile Threat Report 2024 |
| Mobile-targeted phishing sites (2024) | 83% | Zimperium Mobile Threat Report 2024 |
| Lookalike domain attacks increase | 1,265% | Darktrace End-to-End Security Report 2024 |
| Access broker ads on dark web | 50% | CrowdStrike 2025 Global Threat Report |
| Attacks blocked per month | 1 billion+ | Gen Q2/2024 Threat Report |
| Attack increase YoY | 46% | Gen Q2/2024 Threat Report |
| Web-based threats share | 95% | Gen Q2/2024 Threat Report |
| Websites compromised daily | 30,000 | Forbes / Industry Reports |
Zero-Days & Vulnerability Exploitation
Google TAG tracked 75+ zero-day vulnerabilities exploited in the wild in 2024, with enterprise targets increasingly favored over consumer targets. The median time to exploit after disclosure continues to shrink (Mandiant 2025), and the median vulnerability remediation time is 32 days (Verizon DBIR 2025), leaving organizations exposed for weeks.
| Finding | Value | Source |
|---|---|---|
| Zero-day vulnerabilities exploited (2024) | 75 | Google Threat Intelligence Group |
| Enterprise zero-days exploited | 44% | Google Threat Intelligence Group |
| Mobile zero-days exploited | 15 | Google Threat Intelligence Group |
| Browser zero-days exploited | 8 | Google Threat Intelligence Group |
| Time to exploit after disclosure | 5 days | Mandiant M-Trends 2025 / Google Threat Intelligence |
| eCrime breakout time | 48 minutes | CrowdStrike 2025 Global Threat Report |
| Vulnerability exploitation in breaches | 20% | Verizon DBIR 2025 |
| Median vulnerability remediation time | 32 days | Verizon DBIR 2025 |
| Projected CVEs (2026) | 70,000-100,000 | FIRST / SentinelOne |
| High-risk flaw exposure window | 24% | SentinelOne / Industry Reports |
| New vulnerability disclosure frequency | every 17 minutes | SentinelOne / FIRST |
| CVEs exploited in the wild | 1.1% | VulnCheck |
| Critical CVEs increase (2024) | 13% | Coalition Cyber Threat Index |
| CISA KEV catalog total vulnerabilities | 1,484 | CISA / SecurityWeek |
| CISA KEV added (2025) | 245 | CISA / SecurityWeek |
| CISA emergency directive patching window | 93% | CISA |
👤 Identity Theft & Credential Attacks
Stolen credentials are the most common breach vector. 53% of all data breaches involve compromised credentials (Verizon DBIR 2025). Akamai tracks 26 billion credential stuffing attacks per month. Account takeover losses reached significant levels in 2025 (SEON), and infostealer malware surged in 2024 (KnowBe4). Synthetic identity fraud continues to grow as a concern for 67% of organizations (Regula).
MFA adoption remains surprisingly low in enterprise environments (Microsoft 2024), and organizations without phishing-resistant MFA face significantly higher breach rates (Arctic Wolf 2025). SIM swap fraud surged in 2024 (Infisign), and billions of leaked cookies provide attackers with session hijacking opportunities (NordVPN 2025).
| Finding | Value | Source |
|---|---|---|
| FTC identity theft reports (2023) | 1.1 million | FTC Consumer Sentinel Network |
| FTC total fraud losses (2024) | $12.5B | FTC Consumer Sentinel Network 2024 |
| Identity fraud losses (2024) | $47B | Javelin Strategy & Research 2025 Identity Fraud Study |
| Account takeover losses (2025) | $17B | SEON |
| Monthly credential stuffing attacks | 26 billion | Akamai |
| Breaches via stolen credentials | 53% | Verizon DBIR 2025 |
| Credential compromise share | 31% | Verizon DBIR 2024 |
| Enterprise MFA adoption rate | 41% | Microsoft Digital Defense Report 2024 |
| Orgs without phishing-resistant MFA | 76% | Arctic Wolf Threat Report 2025 |
| Infostealer malware increase (2024) | 58% | KnowBe4 Financial Sector Threats Report 2025 |
| Synthetic identity fraud losses | $3.3B | TransUnion |
| Orgs concerned about synthetic identity | 85% | Regula |
| Leaked authentication cookies | 94 billion | NordVPN Research |
| Data breaches involving credential leaks | 16 billion | BlackFog |
| Infostealer credentials harvested (H1 2025) | 1.8 billion | SpyCloud |
| SIM swap fraud surge (2024) | 1,055% | Infisign |
| Credential theft incident cost | $779,707 | Ponemon / DTEX 2025 |
| Credential sharing threat | 31% | Verizon DBIR 2024 |
| Globally breached accounts (2025) | 425.7 million | Surfshark |
| FBI crypto phishing losses (2024) | $28.5M | FBI Internet Crime Report 2024 |
| FBI tech support scam losses (2024) | $1.46B | FBI Internet Crime Report 2024 |
The Credential Bombardment
Approximately 866.7M per day of credential stuffing attempts. That's 10,000 attempts per second, 24/7. (Akamai)
The identity attack surface is expanding. Infostealers harvested billions of credentials in H1 2025 alone (SpyCloud). SIM swap fraud surged (Infisign 2024), enabling attackers to bypass SMS-based MFA. Leaked authentication cookies (NordVPN 2025) allow session hijacking without needing passwords at all. Synthetic identity fraud, where attackers combine real and fake data to create new identities, is a growing concern for financial institutions (TransUnion 2024, Regula).
The defensive gap remains wide. MFA adoption in enterprise environments is surprisingly low (Microsoft 2024), and the majority of organizations still lack phishing-resistant MFA such as FIDO2/passkeys (Arctic Wolf 2025). Zero-trust architecture reduces breach costs significantly (IBM 2025), but adoption remains uneven. Until organizations close the credential hygiene gap, stolen credentials will remain the path of least resistance for attackers.
🏥 Industry Impact
Industry Risk Profile
Select an industry to see its cybersecurity risk profile.
Healthcare remains the most expensive industry for data breaches at $11.2 million per incident, 2.5x the global average and 15 consecutive years at the top of IBM's list. Financial services follow at $6.08 million, facing 300x more attacks than other industries (KnowBe4 2025). Small businesses face a different but equally severe threat: 88% of SMB breaches involve ransomware (Verizon DBIR 2025), and 60% fail within six months of an attack (NCSA).
Most Costly Industries
- Healthcare — $11.2M per breach
- Financial Services — $6.08M per breach
- Critical Infrastructure — $4.82M per breach
Fastest Growing Threats
- Ransomware — +58% increase
- AI-powered attacks — +89% increase
- IoT attacks — +107% increase
Healthcare Pays the Highest Price
Healthcare breach costs are 2.5x the global average. Healthcare has topped IBM's most-expensive-breach industry list for 15 consecutive years, driven by sensitive patient data, legacy medical devices, and regulatory penalties. (IBM Cost of a Data Breach Report 2025)
Healthcare
| Finding | Value | Source |
|---|---|---|
| Healthcare breach cost (2025) | $11.2M | IBM Cost of a Data Breach Report 2025 |
| Healthcare breach cost (2024) | $9.77M | IBM Cost of a Data Breach Report 2024 |
| Healthcare breach cost increase | 42% | IBM / Fortinet |
| Healthcare orgs hit by ransomware | 67% | Sophos State of Ransomware in Healthcare 2024 |
| Healthcare ransomware recovery cost | $2.57M | Sophos State of Ransomware in Healthcare 2024 |
| Healthcare orgs hit by cyberattack | 92% | Ponemon Institute / Proofpoint 2024 Healthcare Study |
| Cyberattacks linked to patient mortality | 28% | Ponemon Institute / Proofpoint 2024 Healthcare Study |
| Healthcare orgs with vulnerable devices | 99% | Claroty State of CPS Security: Healthcare 2025 |
| Healthcare orgs reporting breaches | 540 | HIPAA Journal |
| Healthcare records breached (2024) | 276.8 million | HIPAA Journal |
| Change Healthcare breach records | 190M+ | US Department of Health and Human Services |
| Healthcare ransomware rate (2025) | 54% | Verizon DBIR 2025 |
| Healthcare disruption cost | $1.47M | Ponemon Institute / Proofpoint 2024 Healthcare Study |
| Healthcare breach cost (projected 2026) | $12.6M | VikingCloud / Industry Reports |
| FBI IC3 healthcare incidents (2024) | 444 | FBI IC3 2024 |
| FBI healthcare ransomware incidents | 238 | FBI IC3 2024 |
| HHS healthcare breaches reported (2025) | 642 | HHS Office for Civil Rights |
Financial Services
| Finding | Value | Source |
|---|---|---|
| Financial services breach cost (2025) | $6.08M | IBM Cost of a Data Breach Report 2025 |
| Financial services breach cost (2024) | $5.90M | IBM Cost of a Data Breach Report 2024 |
| Financial sector breach cost (latest) | $6.08M | IBM Cost of a Data Breach Report 2025 |
| Attack frequency vs other industries | 300x | KnowBe4 Financial Sector Threats Report 2025 |
| Financial institutions hit by ransomware | 78% | Sophos State of Ransomware in Financial Services |
| Financial services ransomware rate | 65% | Sophos State of Ransomware in Financial Services 2024 |
| Financial institutions reporting incidents | 64% | Contrast Security Modern Bank Heists Report 2025 |
| US bank third-party breaches | 97% | KnowBe4 Financial Sector Threats Report 2025 |
| Financial API attacks (2024) | 65% | Akamai |
| Financial breach cost (projected 2026) | $6.4M | SentinelOne / Industry Reports |
| Financial credential theft (projected) | 78% | SentinelOne |
| Global financial crime losses | $4.4T | Nasdaq Verafin 2025 Global Financial Crime Report |
| DDoS attacks targeting financial sector | 19% | StormWall |
| Financial DDoS attack growth | 83% | StormWall |
| Financial insider threat cost | $20.68M | Ponemon Institute |
| FBI financial services breaches (2024) | 739 | ITRC / Barracuda |
Small & Medium Businesses
| Finding | Value | Source |
|---|---|---|
| SMBs targeted by cyberattacks | 43% | Cybersecurity Magazine / Verizon |
| SMB average breach cost | $3.31M | IBM Cost of a Data Breach Report 2024 |
| SMBs failing within 6 months of attack | 60% | National Cyber Security Alliance |
| SMBs facing bankruptcy post-attack | 19% | Verizon DBIR 2025 |
| Ransomware in SMB breaches | 88% | Verizon DBIR 2025 |
| SMBs without incident response plan | 57% | Keeper Security 2023 SMB Cybersecurity Survey |
| SMBs with no cyber incident plan (2025) | 34% | Guardz 2025 SMB Cybersecurity Report |
| SMBs overspending on cybersecurity | 58% | ConnectWise State of SMB Cybersecurity 2024 |
| SMBs concerned about AI threats | 83% | ConnectWise State of SMB Cybersecurity 2024 |
| Top SMB threat vector | 75% | VikingCloud |
| SMBs at bankruptcy risk from cyber | 40% | VikingCloud |
| SMB downtime cost per hour | $53,000/hour | VikingCloud |
| SMBs without cybersecurity plan | 50% | Fortinet |
| SMB cybersecurity spend as share of IT | 5%-20% | StrongDM / Deloitte |
| Average SMB recovery cost | $120,000 | PurpleSec / IBM |
| Average SMB recovery cost (2025) | $120,000 | PurpleSec / IBM |
| SMB vs enterprise social eng rate | 350% | Verizon DBIR / StrongDM |
| SMB malicious email rate | 1 in 323 | Verizon DBIR / StrongDM |
| Small org ransomware rate | 47% | Sophos State of Ransomware 2024 |
| SMB cybersecurity spending (2026) | $109B | IT Security Guru |
Other Industries
Education, manufacturing, critical infrastructure, and retail all face escalating threats. Manufacturing was the top ransomware target in 2024 (Group-IB), driven by operational downtime pressure that makes manufacturers more likely to pay. Critical infrastructure breach costs average $4.82 million (IBM 2025), and ransomware targeting critical infrastructure rose significantly (Verizon DBIR 2025).
Education ransomware attacks surged (Sophos 2025), and the education sector's breach cost is substantial (IBM 2025). Utilities saw a significant increase in ransomware incidents (DeepStrike 2025), reflecting the convergence of IT and OT systems. Retail extortion sites grew as ransomware groups increasingly target consumer-facing businesses with customer data exposure threats (SentinelOne 2025).
| Finding | Value | Source |
|---|---|---|
| Education sector breach cost | $3.80M | IBM Cost of a Data Breach Report 2025 |
| Critical infrastructure breach cost | $4.82M | IBM Cost of a Data Breach Report 2025 |
| Education ransomware attacks | 252 | Sophos / VikingCloud |
| Education ransomware (2024) | 116 | Comparitech |
| Manufacturing ransomware (2025) | 1,466 | Industrial Cyber |
| Manufacturing incident share | 34.7% | SentinelOne / Industry Reports |
| Manufacturing: top ransomware target | 660 attacks | Group-IB |
| Utilities ransomware increase | 42% | Fortinet / DeepStrike |
| Critical infra ransomware rate | 28% | Verizon DBIR 2025 |
| Retail extortion sites | 11% | Verizon DBIR 2025 |
Insider Threats
Insider threats remain a costly and persistent challenge. The average insider threat incident costs significant sums to contain, with containment taking weeks (Ponemon 2025). Non-malicious insiders (negligent or compromised employees) account for the majority of insider incidents, and phishing is the primary trigger. Insider threat frequency is increasing across all sectors (Securonix 2025).
| Finding | Value | Source |
|---|---|---|
| Orgs experiencing frequent insider attacks | 48% | Cybersecurity Insiders |
| Insider threat cost (2023) | $16.2M | Ponemon Institute / DTEX 2023 Cost of Insider Risks Report |
| Insider threat cost (projected 2026) | $19.5M | Ponemon Institute / DTEX |
| Insider threat containment time | 86 days | Ponemon Institute / DTEX 2023 Cost of Insider Risks Report |
| Insider containment time (2025) | 81 days | Ponemon Institute / DTEX 2025 Cost of Insider Risks Report |
| Negligent insider share | 55% | Ponemon Institute / DTEX 2025 Cost of Insider Risks Report |
| Non-malicious insider share | 75% | Ponemon / DTEX 2025 |
| Average cost per insider incident | $676,517 | Ponemon / DTEX 2025 |
| Insider breaches (2025) | 30% | Verizon DBIR 2025 |
| Malicious insider breach cost | $4.92M | IBM Cost of a Data Breach Report 2025 |
| Malicious insider cost (latest) | $4.92M | IBM Cost of a Data Breach Report 2025 |
| Insider threat frequency increasing | 74% | Cybersecurity Insiders / VikingCloud |
| Insider frequency increase | 76% | Securonix |
| Insider phishing incident cost | $804,997 | Ponemon Insider Threat Report 2025 |
| Phishing as insider trigger | 55% | Ponemon Insider Threat Report 2025 |
👨💻 Cybersecurity Workforce & Skills Gap
The global cybersecurity workforce gap exceeds 4 million unfilled positions (ISC2 2024). The active workforce has grown but demand outpaces supply. Job growth in cybersecurity significantly outpaces the broader economy (BLS 2024). Burnout is a critical retention issue: the majority of cybersecurity professionals report experiencing burnout, and the rate increased year-over-year (Sophos 2025).
67% of organizations report a moderate-to-critical skills gap (WEF 2025), and those with the most severe shortages pay a breach cost premium of 17.6% ($5.22M vs $4.44M average, IBM 2025). AI security is the number one skill gap (ISC2 2025), followed by cloud security. Budget constraints remain the top cause of understaffing (ISC2 2024).
Workforce Statistics
Cybersecurity workforce demographics are shifting. Workers under 30 represent a growing but still minority share of the workforce (ISC2 2024). Women in cybersecurity are increasing but remain significantly underrepresented. The attrition rate in cybersecurity exceeds other technology fields (BCG 2024), driven by burnout, on-call demands, and the emotional toll of defending against constant attacks. Retention difficulty is a top concern for hiring managers (ISACA 2024).
| Finding | Value | Source |
|---|---|---|
| Global cybersecurity workforce gap | 4.02 million | ISC2 Cybersecurity Workforce Study 2024 |
| Unfilled cybersecurity positions | 4.8 million | ISC2 Cybersecurity Workforce Study 2025 |
| Active cybersecurity workforce | 5.5 million | ISC2 Cybersecurity Workforce Study 2024 |
| Total workforce needed | 10.2 million | ISC2 |
| Cybersecurity job growth rate | 33% | BLS Occupational Outlook Handbook |
| Annual new infosec analyst openings | 17,300 | BLS Occupational Outlook Handbook |
| Unfilled US cybersecurity roles | 570,000 | National Science Foundation |
| Cybersecurity professionals with burnout | 76% | Sophos Addressing Cybersecurity Burnout 2025 |
| Burnout increase YoY | 69% | Sophos Addressing Cybersecurity Burnout 2025 |
| Burnout-related anxiety | 46% | Sophos Addressing Cybersecurity Burnout 2025 |
| Burnout-reduced productivity | 39% | Sophos Addressing Cybersecurity Burnout 2025 |
| Job satisfaction rate | 68% | ISC2 Cybersecurity Workforce Study 2025 |
| Average time to hire cybersecurity staff | 48% | Kaspersky IT Security Survey 2024 |
| Time to fill senior cyber roles | 36% | Kaspersky IT Security Survey 2024 |
| Women in cybersecurity workforce | 22% | ISC2 Cybersecurity Workforce Study 2024 |
| Cybersecurity workforce under 30 | 11% | ISC2 / StationX |
| Cybersecurity workforce over 40 | 60% | ISC2 / StationX |
| Hybrid/remote cyber workers | 56% | ISC2 Cybersecurity Workforce Study 2024 |
| Cybersecurity attrition rate | 17% | BCG / ISC2 |
| Workers affected by burnout | 84% | Bitsight |
| Considering leaving cybersecurity | 24% | Bitsight |
| Orgs with retention difficulty | 60% | ISACA |
| Budget as top staffing cause | #1 | ISC2 |
Skills Gap
The cybersecurity skills gap is not just about headcount. ISC2 reports that skills shortages now pose a greater organizational risk than staffing shortages (ISC2 2024). AI security, cloud security, and zero trust are the top skill needs (ISC2 2025). Organizations with critical skills gaps pay 17.6% more per breach ($5.22M vs $4.44M), and 87% of organizations attribute at least one breach to the skills deficit (Fortinet 2025). Budget constraints remain the top cause of understaffing.
| Finding | Value | Source |
|---|---|---|
| Orgs citing moderate-to-critical skills gap | 67% | WEF Global Cybersecurity Outlook 2025 |
| Orgs unable to assess AI risks | 37% | WEF Global Cybersecurity Outlook 2025 |
| Orgs breached due to skills gap | 54% | Fortinet 2025 Cybersecurity Skills Gap Report |
| Breaches costing > $1M due to skills gap | 52% | Fortinet 2025 Skills Gap Report |
| Breach cost with skills shortage | $5.22M | IBM Cost of a Data Breach Report 2025 |
| Certified staff vs skills gap | 52% | Kaspersky IT Security Survey 2024 |
| Understaffed security teams | 41% | Kaspersky IT Security Survey 2024 |
| Orgs with critical skills needs | 59% | ISC2 Cybersecurity Workforce Study 2025 |
| Skills gap as organizational risk | 58% | ISC2 |
| Skills shortage vs staffing shortage | 64% | ISC2 |
| AI as top needed cyber skill | 41% | ISC2 Workforce Study 2025 |
| Cloud security as needed skill | 36% | ISC2 Workforce Study 2025 |
| Teams with unmet skill needs | 95% | ISC2 Workforce Study 2025 |
| AI vs cyber skill demand gap | 51% vs 49% | Scalo |
The Cost of Understaffing
Skills shortage adds 17.6% to breach costs ($5.22M vs $4.44M average). The cybersecurity talent shortage is directly measurable in breach costs. (IBM Cost of a Data Breach Report 2025)
Salary & Compensation
Cybersecurity salaries remain well above broader IT averages. The US median infosec analyst salary is around $120K (BLS 2024). CISOs command $200K-$350K+ depending on organization size (SentinelOne 2026). UK cybersecurity salaries carry a premium over general IT roles, with London commanding higher rates (Gov.uk 2025). CISSP certification holders earn a significant salary premium (EC-Council 2025).
| Finding | Value | Source |
|---|---|---|
| US median infosec analyst salary | $120,360 | BLS Occupational Outlook Handbook |
| US security engineer salary | $168,767 | Glassdoor |
| US penetration tester salary | $120,090 | Glassdoor |
| US SOC analyst salary | $90,462 | Glassdoor |
| US security architect salary | $192,840 | Glassdoor |
| US GRC analyst salary | $95,380 | Glassdoor |
| CISO salary range | $220,000-$420,000 | SentinelOne / Industry Reports |
| Mid-level cybersecurity salary | $115,000-$212,000 | SentinelOne / Industry Reports |
| Entry-level cybersecurity salary | $74,000-$110,000 | SentinelOne / Industry Reports |
| UK median cybersecurity salary | £55,000 | UK DCMS Cyber Security Skills in the UK Labour Market 2025 |
| UK London cybersecurity salary | £69,800 | UK DCMS Cyber Security Skills in the UK Labour Market 2025 |
| UK cyber salary premium | 12% | UK DCMS Cyber Security Skills 2025 |
| Average CISO tenure | 39 months | Hitch Partners 2025 CISO Survey |
| CISO compensation growth | 6.7% | IANS Research & Artico Search |
| Overall cyber median salary | $120,000 | Redbud Cyber |
| IT median salary (comparison) | $97,000 | Redbud Cyber |
| Cyber premium over IT | $39,000 | Redbud Cyber |
| CISSP salary premium | $25K-$35K | EC-Council |
💵 Security Spending & Market Size
Global cybersecurity spending continues to accelerate. Gartner projects total information security spending will exceed $200 billion in 2025. The cybersecurity market is forecast to reach $271 billion by 2029 at a CAGR of 12-13% (Precedence Research). The US accounts for the largest single market at $80+ billion (Precedence 2025).
Per-employee security spend averages $2,700 (Deloitte 2024), and the majority of CISOs plan to increase budgets next year (PwC 2025). AI-focused security spending is the fastest-growing segment, with the AI cybersecurity market projected to exceed $130 billion by 2030 (VikingCloud).
Overall Spending
Security spending growth consistently outpaces overall IT budgets, reflecting the escalating threat environment. IDC projects double-digit security spending growth through 2028. Per-employee security spend averages $2,700 annually (Deloitte 2024), though this varies widely by industry and organization size. The average SOC budget reaches $14.6 million (KPMG 2024), driven by 24/7 monitoring requirements and the cost of security tools and talent.
| Finding | Value | Source |
|---|---|---|
| Global infosec spending (2025) | $212B | Gartner |
| Security spending (2024) | $215B | Gartner |
| Security spending increase (2025) | 15% | Gartner |
| Total infosec spending (2025) | $213B | Gartner |
| Global cybersecurity spending (2026) | $240B | Fortune Business Insights / SentinelOne |
| Cybersecurity market size (2025) | $227.59B | Precedence Research |
| Projected market size (2034) | $878.48B | Precedence Research |
| Market CAGR | 12.6% | Precedence Research |
| US cybersecurity market (2025) | $87.42B | Precedence Research |
| Security spending growth rate (2025) | 12.2% | IDC |
| Projected security spending (2028) | $377B | IDC |
| Orgs planning to increase security spend | 49% | IBM Cost of a Data Breach Report 2025 |
| Per-employee security spend | $2,700 | Deloitte |
| Security budget as share of IT | 12% | Statista / VikingCloud |
| CISOs planning budget increase | 99% | PwC Digital Trust Insights 2025 |
| Average SOC budget | $14.6M | KPMG 2024 Cybersecurity Survey |
Market Segments
The AI cybersecurity market is the fastest-growing segment, projected to grow from $22 billion in 2023 to $60+ billion by 2028 and $133+ billion by 2030 (MarketsandMarkets, VikingCloud). Identity and access management (IAM), zero trust, endpoint protection, and managed detection and response (MDR) are all multi-billion-dollar markets experiencing double-digit growth. Cyber insurance is maturing rapidly, with the global market approaching $20 billion (Munich Re 2024).
| Finding | Value | Source |
|---|---|---|
| AI cybersecurity market (2023) | $22.4B | MarketsandMarkets |
| AI cybersecurity market (projected 2028) | $60.6B | MarketsandMarkets |
| AI cybersecurity market (projected 2030) | $133B | Techopedia / VikingCloud |
| IAM market size (2025) | $24.1B | MarketsandMarkets / VikingCloud |
| Zero trust adoption rate | 41% | IBM / VikingCloud |
| Endpoint protection market | $19.1B | Gartner |
| Network security market | $29.1B | Gartner |
| Security services market | $86.1B | Gartner |
| CASB/CWPP market | $8.7B | Gartner |
| MSSP market size | $39.47B | MarketsandMarkets |
| MDR market size | $4.19B | Mordor Intelligence |
| MDR market CAGR | 21.95% | Mordor Intelligence |
| CNAPP market size | $10.90B | Mordor Intelligence |
| Application security market | $10.65B | Grand View Research / Mordor Intelligence |
| SIEM market size | $9.73B | SkyQuest / Mordor Intelligence |
| SIEM market projection (2030) | $19.13B | Mordor Intelligence |
| Endpoint security market | $27.46B | MarketsandMarkets |
| Container security market | $3.24B | Mordor Intelligence |
| US cyber insurance premiums | $7.2B | NAIC / Fitch Ratings |
| Global cyber insurance market | $15.3B | Munich Re |
| Large SMB cyber insurance adoption | 75% | SentinelOne / Industry Reports |
| Small SMB cyber insurance adoption | 25% | SentinelOne / Industry Reports |
⚔️ Cyber Warfare & Nation-State Threats
Nation-state cyber operations intensified in 2024-2025. China-nexus espionage operations surged 150% (CrowdStrike 2025), with new adversary groups emerging targeting telecommunications, government, and critical infrastructure. North Korea's Lazarus Group executed a $1.5 billion cryptocurrency heist against ByBit in 2025. Microsoft tracks 600+ nation-state threat groups. Geopolitical events are now a primary driver of cybersecurity strategy for most organizations (WEF 2025).
Government ransomware attacks continue to cause significant downtime and cost. Taiwan faces 30+ million daily cyberattacks (CSIS 2024). Election interference via DDoS and disinformation remains an active threat vector (Cloudflare 2024, Tidal Cyber).
Nation-State Threat Actors
The four primary nation-state cyber adversaries are China, Russia, North Korea, and Iran. China focuses on espionage and intellectual property theft, with a 150% surge in operations (CrowdStrike 2025). North Korea uniquely combines state espionage with financial theft, stealing $1.5 billion in a single cryptocurrency heist (Lazarus/ByBit 2025). Russia-nexus groups focus on disruptive attacks and election interference. Iran targets regional adversaries and critical infrastructure.
| Finding | Value | Source |
|---|---|---|
| China espionage operations surge | 150% | CrowdStrike 2025 Global Threat Report |
| China-targeted sectors | 300% | CrowdStrike 2025 Global Threat Report |
| New China-nexus adversaries (2024) | 7 | CrowdStrike 2025 Global Threat Report |
| Nation-state threat groups tracked | 1,500+ | Microsoft Digital Defense Report 2024 |
| North Korea crypto theft (2024) | $3B | Microsoft Digital Defense Report 2024 |
| Geopolitical impact on cyber strategy | 60% | WEF Global Cybersecurity Outlook 2025 |
| Espionage-motivated breaches | 17% | Verizon DBIR 2025 |
| Ukraine cyber incidents (2024) | 4,315 | CERT-UA / Ukraine State Service |
| North Korean IT worker infiltrations | 304 | CrowdStrike 2025 Global Threat Report |
| Lazarus Group ByBit heist (2025) | $1.5B | FBI IC3 |
| Taiwan daily cyberattacks (2024) | 2.4 million | CSIS |
| Geopolitical events changing cyber strategy | 66% | WEF Global Cybersecurity Outlook 2026 |
| Geopolitical attacks in risk accounting | 64% | WEF Global Cybersecurity Outlook 2026 |
| Countries lacking cyber confidence | 31% | WEF Global Cybersecurity Outlook 2026 |
| WEF geopolitical cyber strategy outlook | 66% | WEF Global Cybersecurity Outlook 2026 |
Government Cybersecurity Spending & Impact
Governments are increasing cybersecurity budgets in response to escalating nation-state threats. The US civilian cybersecurity budget and DoD cyber budget both reflect federal prioritization. The UK, Australia, and EU have all committed significant multi-year funding. Yet government ransomware attacks continue: ransomware hit government organizations at high rates (Sophos 2024), and downtime costs for US government agencies are substantial (Comparitech).
Election security is a growing focus. Tidal Cyber identified multiple state-backed threat actors targeting election infrastructure in 2024. Cloudflare reported significant DDoS attacks against US election infrastructure. Government encryption rates in ransomware attacks remain concerning, as attackers successfully encrypt government data a majority of the time (Sophos 2024). Recovery costs for government organizations are high, reflecting bureaucratic procurement processes and legacy IT systems.
| Finding | Value | Source |
|---|---|---|
| US civilian cybersecurity budget | $13B | WhiteHouse.gov FY25 Budget |
| US DoD cybersecurity budget | $13.5B | US Department of Defense |
| UK government cybersecurity investment | £2.6B | UK National Cyber Strategy 2022 |
| Australia cybersecurity strategy funding | A$586.9M | Australian Government Department of Home Affairs |
| EU cybersecurity reserve | €36M | ENISA (EU Agency for Cybersecurity) |
| CEOs concerned about cyber espionage | 33% | WEF Global Cybersecurity Outlook 2025 |
| Government ransomware attacks | 179 | Comparitech |
| Government avg ransom demand | $2.3M | Comparitech |
| Government downtime cost (US) | $70B | Comparitech |
| Government ransomware rate | 34% | Sophos State of Ransomware 2024 |
| Government recovery cost | $2.83M | Sophos State of Ransomware 2024 |
| Government encryption rate | 98% | Sophos State of Ransomware 2024 |
| Election-targeted state threat actors | 64% | Tidal Cyber |
| Election DDoS attacks (US 2024) | 6 billion+ | Cloudflare |
🛡️ Privacy & Regulation
Cumulative GDPR fines have exceeded $5 billion since enforcement began (DLA Piper 2026). Breach notifications continue to rise year-over-year. Over 160 countries now have data protection laws (Greenleaf 2025), and AI governance is the newest regulatory frontier. Organizations failing compliance add significant costs to their breach expenses (IBM 2025).
CISOs increasingly cite regulatory fragmentation as a top challenge (WEF 2025). Shadow AI governance gaps expose organizations to data compromise: organizations without AI upload controls or governance frameworks face higher breach costs. Privacy spending delivers positive ROI, with organizations seeing 1.6x+ returns on privacy investments (Cisco 2025).
| Finding | Value | Source |
|---|---|---|
| Cumulative GDPR fines (2026) | €7.1B | DLA Piper GDPR Fines Survey 2026 |
| Cumulative GDPR fines (2025) | €5.88B | DLA Piper GDPR Fines and Data Breach Survey 2025 |
| Ireland GDPR fines total | €3.5B | DLA Piper GDPR Fines Survey 2025 |
| GDPR breach notifications increase | 22% | DLA Piper GDPR Fines Survey 2026 |
| GDPR fines (2023 annual) | €1.6B | Statista |
| GDPR enforcement fines (2023) | €1.6B | Statista / Cobalt |
| Countries with data protection laws | 172 | Graham Greenleaf, UNSW Law Research Paper 2025 |
| Countries with privacy laws (2025) | 79% | CookieYes / UN Trade and Development |
| Privacy spending ROI | 96% | Cisco 2025 Data Privacy Benchmark Study |
| Compliance failure added breach cost | $1.22M | IBM Cost of a Data Breach Report 2025 |
| CISOs citing regulatory fragmentation | 76% | WEF Global Cybersecurity Outlook 2025 |
| Shadow AI breach cost | $4.63M | IBM Cost of a Data Breach Report 2025 |
| Orgs requiring AI approval | 45% | IBM Cost of a Data Breach Report 2025 |
| Orgs testing for adversarial AI | 22% | IBM Cost of a Data Breach Report 2025 |
| AI data compromise rate | 60% | IBM Cost of a Data Breach Report 2025 |
| AI third-party SaaS breaches | 29% | IBM Cost of a Data Breach Report 2025 |
| AI open-source model breaches | 26% | IBM Cost of a Data Breach Report 2025 |
| Personal cyber fraud impact | 73% | WEF Global Cybersecurity Outlook 2025 |
| Financial crime compliance cost | $275B | Napier AI AML Index 2025 |
AI governance is emerging as the next major regulatory frontier. Organizations without AI upload controls, approval workflows, or adversarial AI testing face higher breach costs and data compromise rates (IBM 2025). The EU AI Act, US executive orders on AI safety, and sector-specific AI guidance from financial regulators are creating a new compliance layer that security teams must navigate alongside existing GDPR, CCPA, HIPAA, and PCI DSS obligations.
☁️ Cloud Security
Cloud intrusions increased 75% year-over-year (CrowdStrike 2024). Misconfiguration remains the leading cause of cloud breaches, with Gartner projecting 99% of cloud security failures through 2025 will be the customer's fault. Multi-cloud adoption continues to rise, creating complexity in security management. Hybrid cloud environments face breach costs of $4.97M (IBM 2025).
Kubernetes security incidents affected the majority of organizations using containers (Red Hat 2024), with misconfiguration as the primary cause. Cloud credential incidents rose significantly (CrowdStrike 2024). Organizations with breaches spanning multiple environments face the highest costs at $5M+ (IBM 2025).
| Finding | Value | Source |
|---|---|---|
| Cloud breaches from credentials | 82% | Thales Group 2023 Cloud Security Study |
| Cloud breaches from misconfiguration | 15% | Verizon DBIR 2023 |
| Cloud misconfiguration incidents | 27% | SentinelOne |
| Cloud failures from human error | 95% | SentinelOne / Industry Reports |
| Cloud security failures: customer fault | 99% | Gartner |
| Cloud exposed resources | 70% | Astra / Industry Reports |
| Cloud intrusion increase (2024) | 26% | CrowdStrike 2025 Global Threat Report |
| Cloud credential incidents | 35% | CrowdStrike 2025 Global Threat Report |
| Cloud phishing attacks | 33% | IBM X-Force |
| Multi-cloud adoption rate | 78% | Fortinet / Cybersecurity Insiders 2024 Cloud Security Report |
| Multi-cloud operations (2026) | 88% | SentinelOne / Industry Reports |
| Cloud identity breaches (projected) | 70% | SentinelOne / Industry Reports |
| Hybrid cloud breach cost | $3.8M | IBM / UpGuard |
| Hybrid cloud environment breach cost | $3.8M | IBM / UpGuard |
| On-premises breach cost | $4.01M | IBM Cost of a Data Breach Report 2025 |
| Public cloud breach lifecycle | 247 days | IBM Cost of a Data Breach Report 2025 |
| Multiple environment breach cost | $5.05M | IBM Cost of a Data Breach Report 2025 |
| Multiple environment breach cost (latest) | $5.05M | IBM Cost of a Data Breach Report 2025 |
| Supply chain as security barrier | 54% | WEF Global Cybersecurity Outlook 2025 |
| Kubernetes security incidents | 90% | Red Hat |
| K8s incidents from misconfiguration | 45% | Red Hat |
| Container security market | $3.24B | Mordor Intelligence |
The shift to multi-cloud environments adds complexity. Organizations running workloads across 3+ cloud providers face significantly higher breach costs than single-cloud or on-premises operations (IBM 2025). Kubernetes-specific security incidents are particularly concerning: the majority of organizations running containers experienced security incidents, with misconfiguration as the primary root cause (Red Hat 2024). Container security and CNAPP (Cloud-Native Application Protection Platform) are the fastest-growing cloud security market segments.
Human error remains the dominant cause of cloud security failures. Gartner projects that through 2025, 99% of cloud security failures will be the customer's fault, not the provider's. Exposed cloud resources, misconfigured storage buckets, and overly permissive IAM policies continue to be the most exploited cloud attack vectors. Organizations with hybrid cloud environments face breach costs near the global average, while those spanning multiple environments pay the highest premiums (IBM 2025).
📱 IoT Security
IoT attacks surged 107% in 2024 (SonicWall). Connected IoT endpoints are projected to reach 29+ billion by 2027 (Statista). 98% of IoT traffic is unencrypted (Palo Alto Networks). Medical device security is a critical concern: 99% of healthcare organizations have devices with known exploited vulnerabilities (Claroty 2025), and medical imaging devices frequently run unsupported operating systems.
OT and ICS environments face mounting ransomware threats, with ICS vulnerabilities rising in H2 2024 (Nozomi). Unmanaged devices remain a primary ransomware entry point (Microsoft 2024). Router vulnerabilities continue to be a significant discovery vector (Forescout 2025).
| Finding | Value | Source |
|---|---|---|
| Connected IoT endpoints (projected 2027) | 29.7 billion | Statista |
| IoT attack surge (2024) | 107% | SonicWall 2024 Mid-Year Cyber Threat Report |
| IoT attacks daily (projected 2026) | 820,000+ | DeXpose / SentinelOne |
| IoT malware surge (2026) | 124% | SentinelOne / Industry Reports |
| IoT traffic unencrypted | 98% | Palo Alto Networks Unit 42 |
| IoT devices vulnerable to attack | 70% | CybelAngel / HP |
| Hospital devices with known exploits | 23% | Claroty State of CPS Security: Healthcare 2023 |
| Healthcare orgs with vulnerable devices | 99% | Claroty State of CPS Security: Healthcare 2025 |
| Connected medical devices (projected) | 7.4 million | SentinelOne / Industry Reports |
| Medical imaging on unsupported OS | 83% | SentinelOne / Industry Reports |
| Ransomware from unmanaged devices | 90%+ | Microsoft Digital Defense Report 2024 |
| Router vulnerabilities discovered | 50%+ | Forescout Riskiest Connected Devices 2025 |
| ICS vulnerabilities (H2 2024) | 619 | Nozomi Networks OT/IoT Security Report 2025 |
| OT ransomware surge (2025) | 46% | Nozomi Networks |
| ICS ransomware increase (Q2 2024) | 20% | Kaspersky ICS CERT |
| IoT critical vulnerabilities (2025) | 50%+ | JumpCloud |
| BadBox botnet compromised devices | 10 million+ | Google / Trend Micro |
The convergence of IT and OT (Operational Technology) networks creates new attack surfaces. ICS (Industrial Control Systems) vulnerabilities rose in H2 2024 (Nozomi), and OT ransomware surged in 2025. Manufacturing, energy, and utilities sectors are particularly exposed. Medical devices present a critical risk in healthcare: imaging systems running unsupported operating systems cannot be easily patched, and 99% of healthcare organizations have at least one device with known exploited vulnerabilities (Claroty 2025).
Consumer IoT devices are increasingly weaponized. Google discovered the BadBox botnet compromising millions of Android-based devices (2025). 98% of IoT traffic remains unencrypted (Palo Alto Networks), meaning intercepted data is immediately readable. Router vulnerabilities are a growing discovery target, with Forescout finding critical flaws in widely deployed enterprise and consumer models. The IoT attack surface will continue expanding as connected endpoints approach 29+ billion by 2027 (Statista).
🇺🇸 Country Data: United States
The United States has the highest average data breach cost globally at $10.22 million, an all-time high (IBM 2025). US data breaches hit a record 3,322 in 2025, up 4% year-over-year (Barracuda). The FBI IC3 received 859,532 complaints in 2024, with total losses of $16.6 billion. Investment fraud ($6.57B) and BEC ($2.9B) were the costliest categories.
The US cybersecurity market exceeds $80 billion (Precedence 2025), accounting for the largest share of global spending. North America holds the dominant market share. The US civilian cybersecurity budget and DoD cyber budget both reflect federal prioritization of cyber defense. California alone accounted for the highest state-level FBI IC3 losses.
| Finding | Value | Source |
|---|---|---|
| US average breach cost (all-time high) | $10.22M | IBM Cost of a Data Breach Report 2025 |
| US data breaches (record) | 3,322 | Barracuda Networks / ITRC |
| FBI IC3 total losses (2024) | $16.6B | FBI Internet Crime Report 2024 |
| FBI IC3 total losses (2023) | $12.5B | FBI Internet Crime Report 2023 |
| FBI IC3 complaints (2024) | 859,532 | FBI Internet Crime Report 2024 |
| FBI investment fraud losses | $6.57B | FBI Internet Crime Report 2024 |
| FBI BEC losses (2024) | $2.77B | FBI Internet Crime Report 2024 |
| FBI phishing complaints | 193,407 | FBI Internet Crime Report 2024 |
| FBI avg loss per complaint | $19,400 | FBI Internet Crime Report 2024 |
| FBI fraud funds frozen | $469.1M | FBI IC3 2024 |
| FBI California losses (top state) | $2.16B | FBI Internet Crime Report 2024 |
| US cybercrime density | 1,494 | AAG IT / Surfshark |
| Cybercrime prosecution rate | 0.05% | WEF Global Cybersecurity Outlook 2025 |
| Unfilled US cybersecurity roles | 570,000 | National Science Foundation |
| US breach notifications (2024) | 1.73 billion | ITRC |
| North America security market share | 43% | Fortune Business Insights |
| US civilian cyber budget | $13B | WhiteHouse.gov FY25 Budget |
| US DoD cyber budget | $13.5B | US Department of Defense |
| US cybersecurity market | $87.42B | Precedence Research |
🇬🇧 Country Data: United Kingdom
The UK faces a significant cybercrime burden. Large businesses report the highest breach rates, followed by medium and small businesses (Gov.uk 2025). The UK government invested heavily in cybersecurity as part of its national cyber strategy. London commands premium cybersecurity salaries, and the cyber salary premium over general IT roles reflects sustained demand.
| Finding | Value | Source |
|---|---|---|
| UK large business breach rate | 74% | UK DCMS Cyber Security Breaches Survey 2025 |
| UK medium business breach rate | 67% | UK DCMS Cyber Security Breaches Survey 2025 |
| UK small business breach rate | 42% | UK DCMS Cyber Security Breaches Survey 2025 |
| UK cybercrime density | 4,783 | AAG IT / Surfshark |
| UK estimated cyber crimes (2025) | 8.58 million | UK Cyber Security Breaches Survey 2025 |
| UK median cybersecurity salary | £55,000 | UK DCMS Cyber Security Skills in the UK Labour Market 2025 |
| UK London cybersecurity salary | £69,800 | UK DCMS Cyber Security Skills in the UK Labour Market 2025 |
| UK cyber salary premium over IT | 12% | UK DCMS Cyber Security Skills 2025 |
| UK government cybersecurity investment | £2.6B | UK National Cyber Strategy 2022 |
The UK Cyber Security Breaches Survey (Gov.uk 2025) reveals a clear size-based vulnerability gradient. Large businesses face the highest breach rates, followed by medium and small enterprises. The UK's National Cyber Strategy drives continued government investment. The cybersecurity salary premium over general IT roles reflects persistent demand for skilled professionals, with London commanding the highest rates in the country (Gov.uk 2025).
🌐 Country Data: Global & Regional
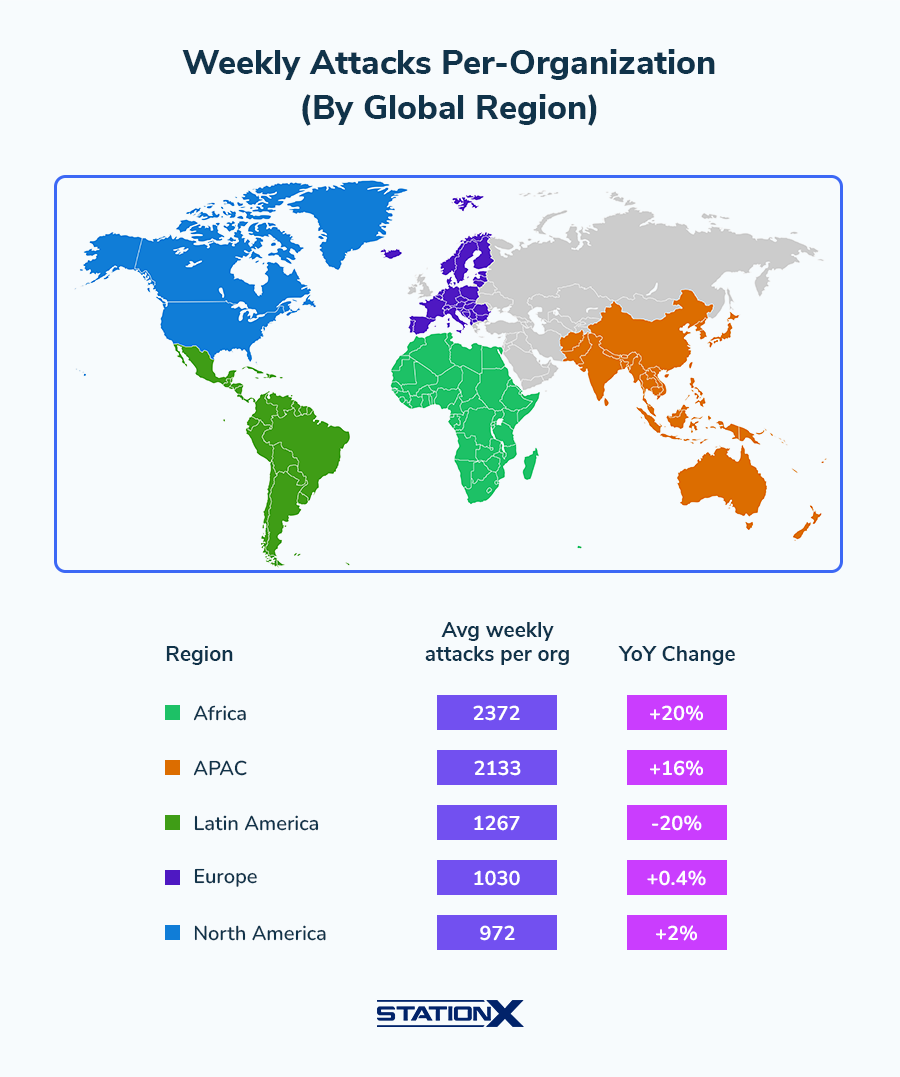
Cyber threats are global but impact regions differently. The APAC region has a significant unfilled cybersecurity roles gap (ISC2 2024) and a growing market (FBI/industry). Africa and Latin America report the lowest cyber confidence levels (WEF 2025-2026). The Middle East, Japan, Germany, and Brazil all have billion-dollar cybersecurity markets and face distinct threat profiles.
India faces a 24% rise in ransomware (CERT-In) and projected weekly attack volumes continue to climb (SentinelOne 2026). Singapore is increasing its cyber budget (Sophos 2025). Taiwan faces an extraordinary volume of daily cyberattacks (CSIS 2024), primarily attributed to Chinese state actors.
| Finding | Value | Source |
|---|---|---|
| Germany breach cost | $4.03M | IBM Cost of a Data Breach Report 2025 |
| Canada breach cost | $4.84M | IBM Cost of a Data Breach Report 2025 |
| France breach cost | $3.73M | IBM Cost of a Data Breach Report 2025 |
| Japan breach cost | $3.65M | IBM Cost of a Data Breach Report 2025 |
| Australia breach cost | $2.55M | IBM Cost of a Data Breach Report 2025 |
| Brazil breach cost | $1.22M | IBM Cost of a Data Breach Report 2025 |
| Brazil breach cost (BRL) | R$7.19M | IBM / TI Inside |
| India breach cost | $2.51M | IBM Cost of a Data Breach Report 2025 |
| India ransomware rise (2024) | 24% | CERT-In / Industry reports |
| India weekly attacks (projected) | 3,195 | SentinelOne / Check Point Research |
| APAC unfilled cybersecurity roles | 3.4 million | ISC2 Cybersecurity Workforce Study 2024 |
| APAC cybersecurity market | $45.28B | Fortune Business Insights |
| Africa cyber confidence level | 36% | WEF Global Cybersecurity Outlook 2025 |
| Latin America cyber confidence | 13% | WEF Global Cybersecurity Outlook 2026 |
| Latin America cyber confidence (2025) | 42% | WEF Global Cybersecurity Outlook 2025 |
| Middle East cybersecurity market | $16.75B | Mordor Intelligence |
| Middle East market (alternate) | $20.55B | MarketsandMarkets |
| Japan cybersecurity market | $10.34B | Mordor Intelligence |
| Germany cybersecurity market | $8.04B | Statista |
| Brazil cybersecurity market | $2.88B | Statista |
| Singapore cyber budget increase | 80% | Sophos / US Trade.gov |
| Taiwan daily cyberattacks | 2.4 million | CSIS |
| Africa: weekly attacks per org (highest) | 2,372 | Check Point Research |
| APAC: weekly attacks per org | 2,133 | Check Point Research |
| Europe: weekly attacks per org | 1,030 | Check Point Research |
| North America: weekly attacks per org | 972 | Check Point Research |
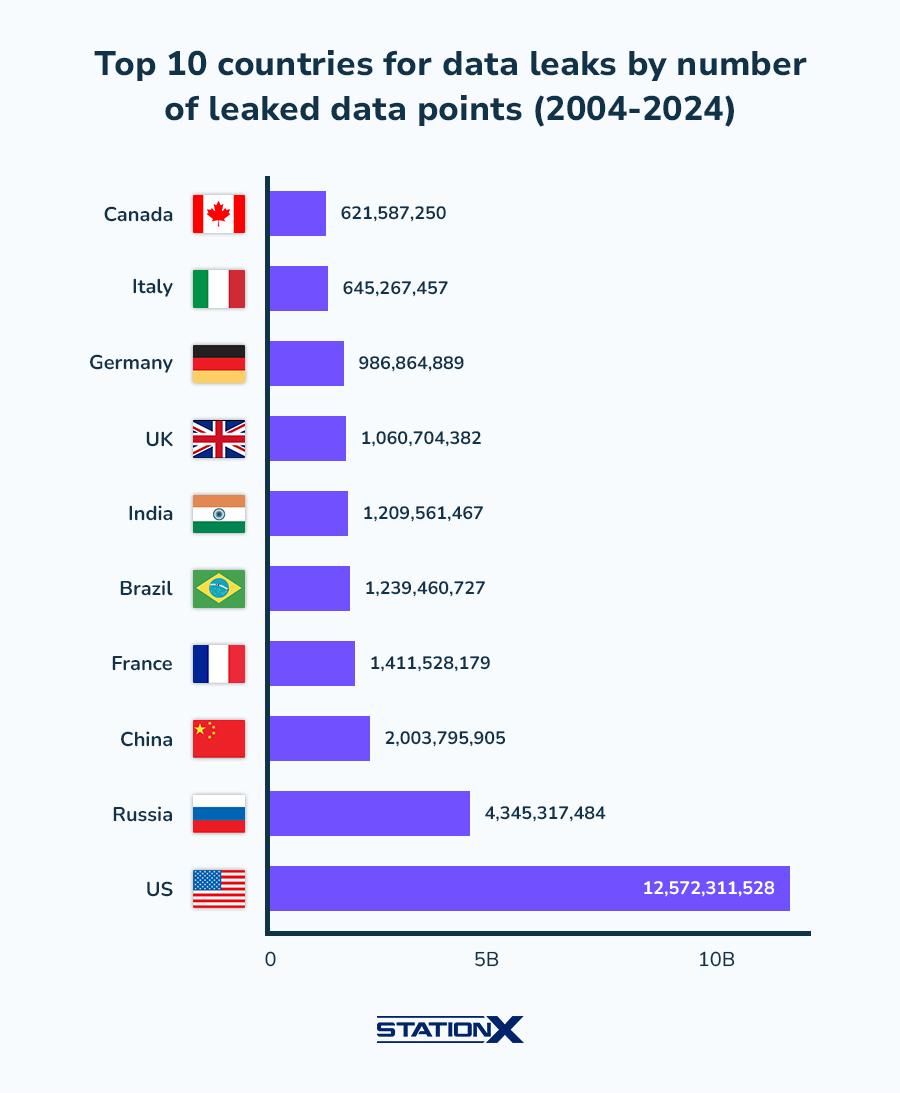
| US cumulative data leaks (2004-2024) | 12.57 billion | Surfshark / StationX Analysis |
| Russia cumulative data leaks | 4.35 billion | Surfshark / StationX Analysis |
Regional cybersecurity maturity varies enormously. Africa and Latin America report the lowest confidence in national cyber resilience (WEF 2025-2026), reflecting gaps in regulation, workforce, and infrastructure investment. The Middle East cybersecurity market is growing rapidly, driven by digital transformation and nation-state threat awareness. Japan's market reflects the country's advanced digital economy and proximity to China-nexus threats. Germany and Brazil both have billion-dollar security markets growing at double-digit rates, yet face distinct threat profiles rooted in their industrial bases and regulatory environments.
About This Data
This article draws from 1479 statistics aggregated from 50+ authoritative sources including IBM Cost of a Data Breach, Verizon DBIR, CrowdStrike Global Threat Report, WEF Global Cybersecurity Outlook, FBI IC3, ISC2 Cybersecurity Workforce Study, Sophos, Gartner, Mandiant M-Trends, and Ponemon Institute reports.
Derived statistics (marked "Nathan House's Analysis") are computed by cross-referencing data from multiple sources — for example, comparing breach costs across industries using IBM data, or validating ransomware trends across Verizon, Sophos, and HIPAA Journal findings.
All statistics include inline source citations with links to primary sources. Data spans 2023-2026, with preference given to the most recent available figures. Last updated: June 2026.
How to Use This Data
Security professionals can use these statistics to build business cases for cybersecurity investment, benchmark their organization's risk profile against industry averages, and justify budget requests with hard data. Use the contrast boxes and derived statistics to highlight cost differentials that resonate with executive decision-makers.
This page is updated monthly as new reports are published. Bookmark it and return for the latest data. If you spot an outdated statistic or want to suggest a source, contact us.
About the Author

Nathan House, Founder & CEO of StationX
Nathan House has 30 years of hands-on cybersecurity experience and is Cambridge-educated, holding CISSP, CISA, CISM, OSCP, CEH, and SABSA. He founded StationX in 1999 — one of the UK’s first cybersecurity companies — and has secured £71 billion in UK mobile banking transactions and the London 2012 Olympics, advising clients including Microsoft, Cisco, BP, Vodafone, and VISA. He authored the world’s most popular cybersecurity course — a #1 Udemy bestseller taken by over 500,000 students — and was named Cyber Security Educator of the Year 2020, AI Security Educator of the Year, and a UK Top 25 Security Influencer 2025. A DEF CON speaker and featured expert on CNN, Fox News, NBC, and the BBC, Nathan leads StationX’s training of more than half a million students worldwide.