DDoS Statistics 2026: Attack Data, Records & Trends

20.5 million DDoS attacks in a single quarter (Cloudflare Q1 2025). A record-breaking 31.4 Tbps assault that lasted just 35 seconds (Bleeping Computer). Network-layer attacks up 509% year over year. DDoS is no longer a nuisance — it is the defining threat vector of 2026, weaponised by nation-states, amplified by AI, and cheaper to launch than a restaurant meal.
Below you will find 52+ statistics across 11 sections — covering attack volumes, record-breaking incidents, industry targeting, geopolitical weaponisation, and the cost of downtime. Sourced from Cloudflare, Radware, Zayo, and 15+ authoritative reports, with original cross-referenced analysis in every section.
Key DDoS Takeaways
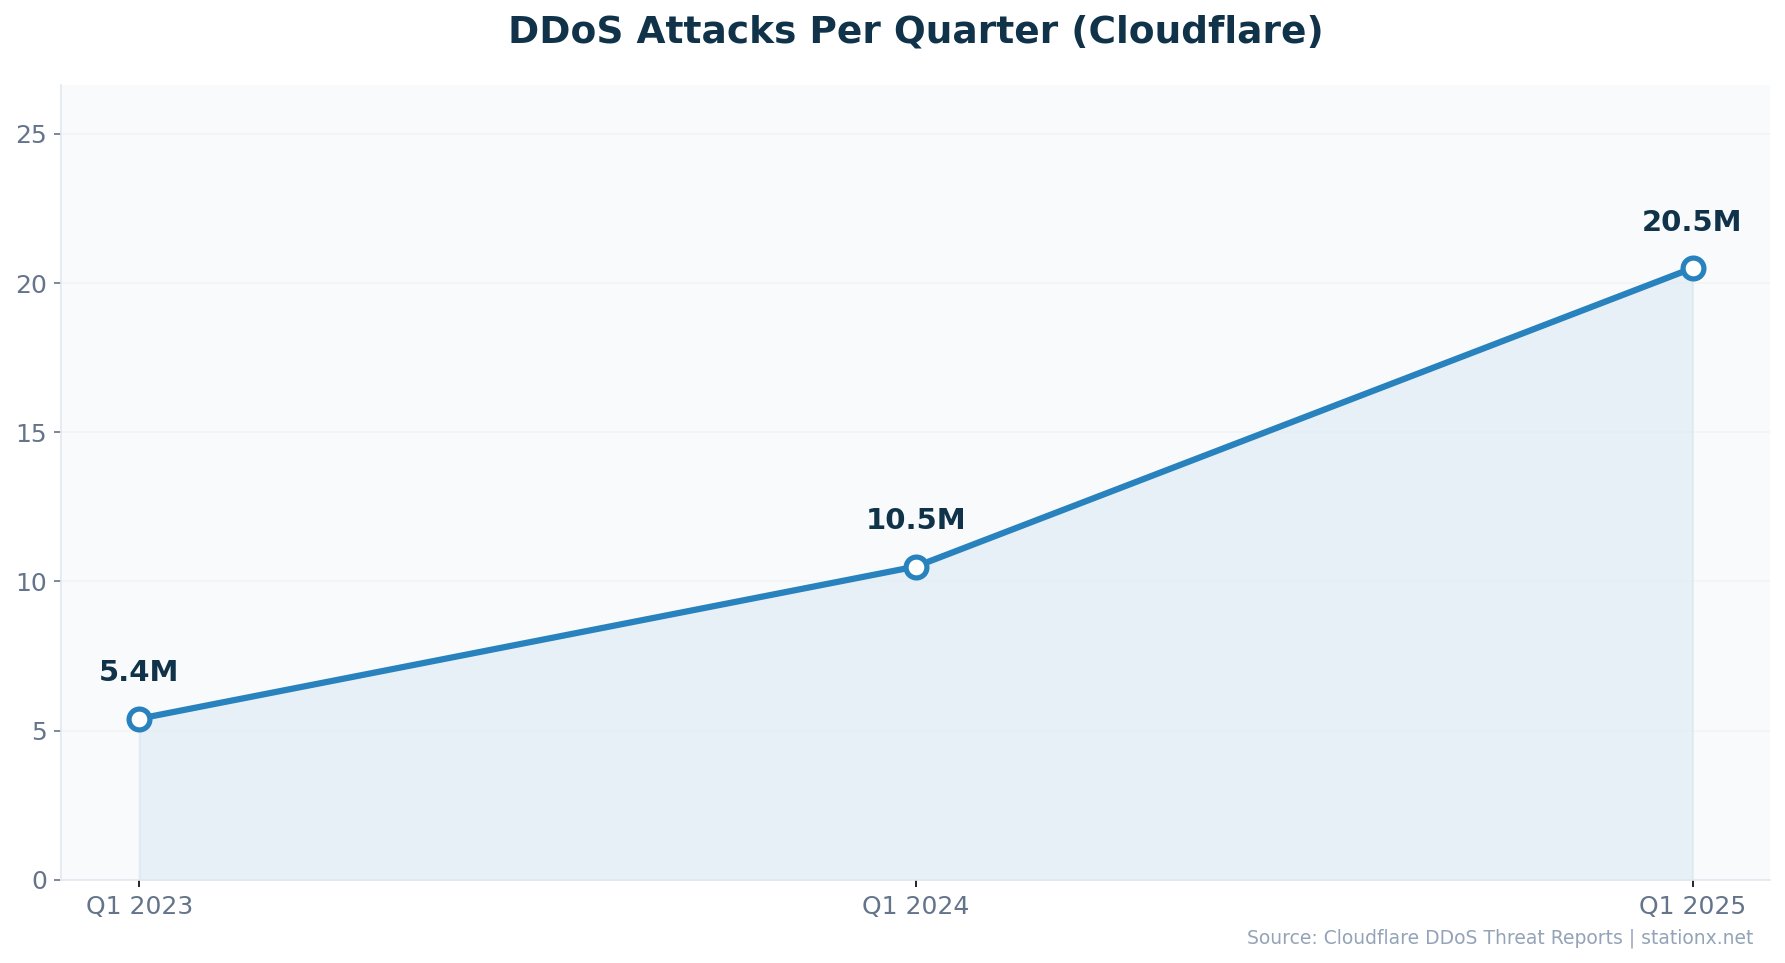
- Cloudflare blocked 20.5 million DDoS attacks in Q1 2025 — 96% of its entire 2024 total
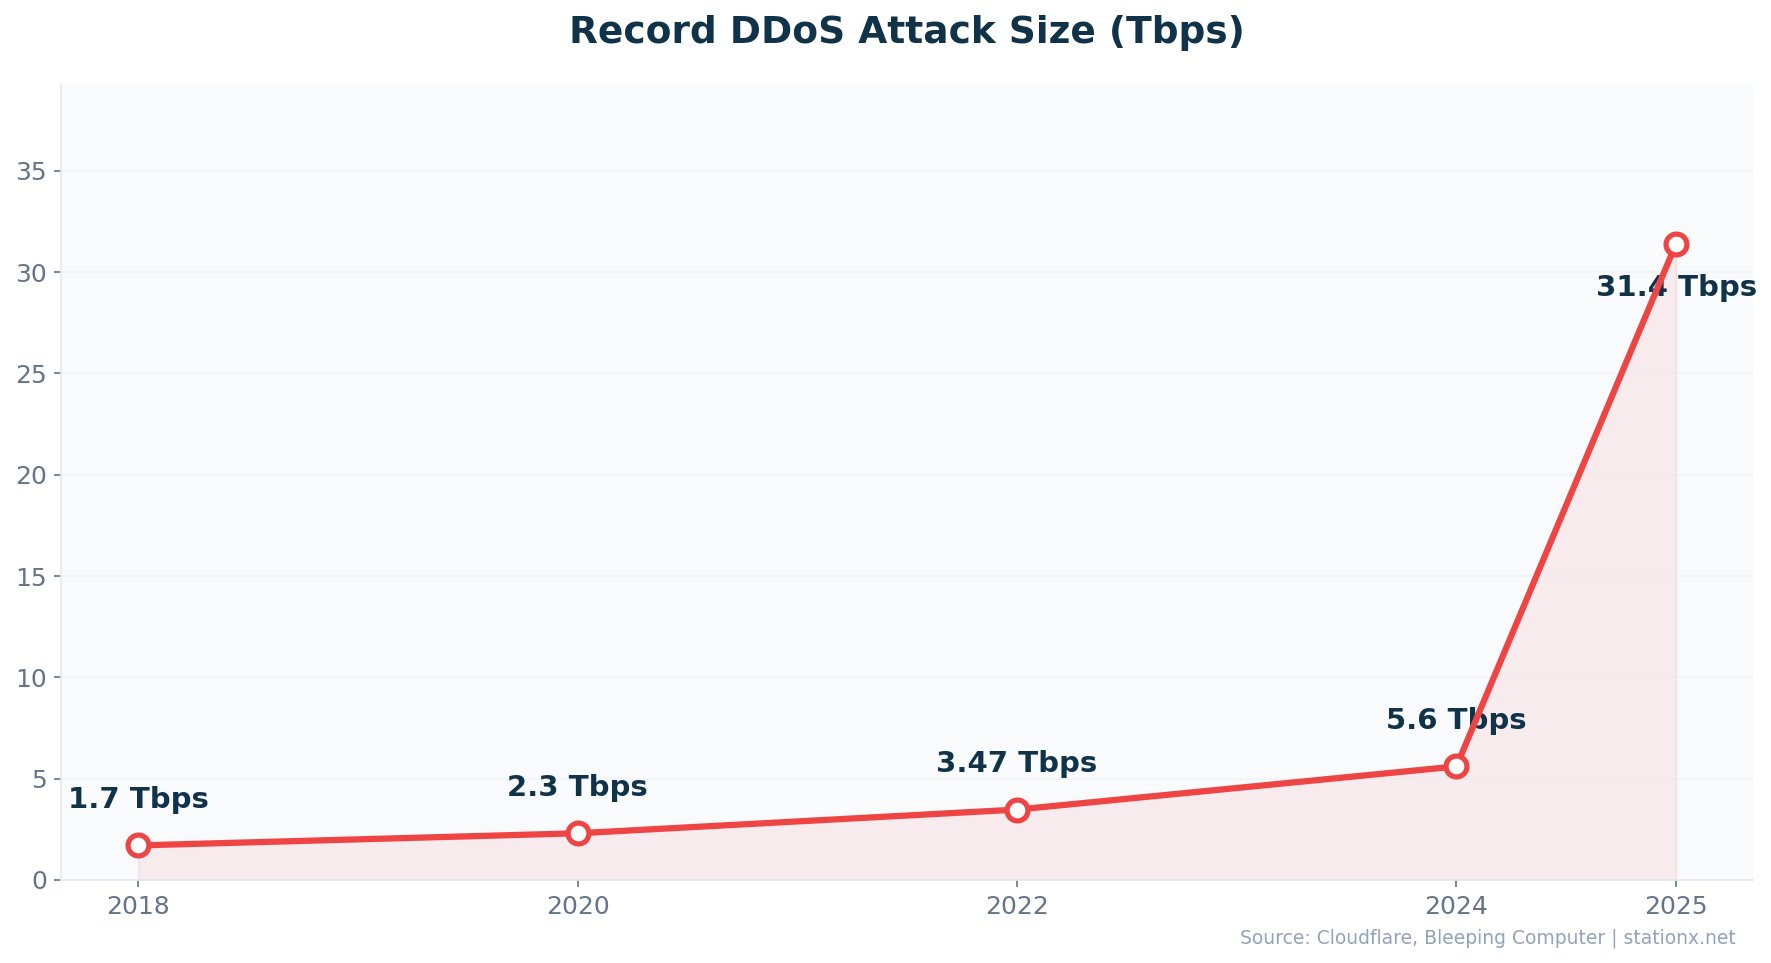
- The largest attack ever reached 31.4 Tbps, an 726% increase from the 3.8 Tbps record set just 14 months earlier
- Network-layer DDoS attacks surged 509% YoY while application-layer attacks rose 74%
- 89% of DDoS attacks now last under 10 minutes — hit-and-run is the new default
- Every minute of DDoS downtime costs an average of $22,000 ($1,320,000/hour)
- A DDoS-for-hire service costs as little as $38/hour — the attacker-to-defender cost ratio is 1:3158
- Israel is the most targeted country for geopolitical DDoS (12.2% of all claimed attacks)
- The DDoS protection market is projected to reach $10.39 billion by 2030 (12.3% CAGR)
📊 Key DDoS Statistics
These are the headline DDoS statistics for 2026. The numbers come from Cloudflare, Radware, Zayo, and MarketsandMarkets — each covering different aspects of the DDoS threat landscape.
| Finding | Value | Source |
|---|---|---|
| Average daily DDoS attacks worldwide | 44,000 | SentinelOne / Industry Reports |
| DDoS attacks blocked by Cloudflare (Q1 2025) | 20.5 million | Cloudflare |
| Largest DDoS attack ever recorded | 31.4 Tbps | Bleeping Computer |
| Year-over-year increase in DDoS attacks (Q1 2025) | 358% | Cloudflare |
| Network-layer DDoS increase (2025) | 168% | Radware |
| Cost of downtime per minute | $22,000 | MazeBolt |
| Total DDoS attacks globally (2025) | 47.1 million | Gcore |
| DDoS protection market by 2030 | $10.39 billion | MarketsandMarkets |
Nathan House's Analysis: The Scale of Acceleration
Cloudflare blocked 20.5 million DDoS attacks in Q1 2025 alone — 96% of what it blocked in all of 2024. Meanwhile, Radware reports a separate 168% year-over-year increase. Cross-referencing both reports, the data points in the same direction: DDoS volume is not just growing, it is compounding. At 1.5 attacks per second globally (47.1 million in 2025), DDoS has become background radiation on the internet.
📈 DDoS Attack Volume & Frequency
47.1 million DDoS attacks hit the global internet in 2025 (Gcore). Cloudflare alone mitigated 20.5 million in Q1, while Radware's average customer faced 139 attacks per day in H2 2025. The frequency is not spiking — it is sustaining at all-time highs.
| Finding | Value | Source |
|---|---|---|
| DDoS attacks blocked (Cloudflare Q1 2025) | 20.5 million | Cloudflare |
| Year-over-year increase (Q1 2025) | 358% | Cloudflare |
| Network-layer attacks blocked (Q1 2025) | 16.8 million | Cloudflare |
| Network-layer YoY increase | 509% | Cloudflare |
| HTTP DDoS attack YoY increase | 118% | Cloudflare |
| Network-layer DDoS increase (Radware 2025) | 168% | Radware |
| Average attacks per customer per day (H2 2025) | 139 | Radware |
| Web DDoS increase YoY (2025) | 101% | Radware |
| Total DDoS attacks globally (2025) | 47.1 million | Gcore |
| Average daily attacks worldwide | 44,000 | SentinelOne / Industry Reports |
| DDoS attack surge (2024) | 550% | Security Brief |
DDoS Attack Volume Growth (Cloudflare Data)
Nathan House's Analysis: 139 Attacks Per Day, Per Customer
Radware reports its average customer faced 139 DDoS attacks per day in H2 2025. That is not a spike — it is a sustained barrage. Cross-referencing with Cloudflare's Q1 data showing 20.5 million attacks in 90 days (227,000+ per day across their network), both sources confirm the same pattern: DDoS has shifted from occasional events to constant pressure.
💥 Largest DDoS Attacks in History
31.4 Tbps. That is the new all-time record, set by the Aisuru botnet in December 2025 and lasting just 35 seconds (Bleeping Computer). The DDoS bandwidth record was broken at least five times in 2025, with attack sizes increasing over 700% from the late-2024 benchmarks.
| Finding | Value | Source |
|---|---|---|
| Aisuru botnet (Dec 2025) — all-time record | 31.4 Tbps | Bleeping Computer |
| Unnamed attack (2025) — 22.2 Tbps | 22.2 Tbps | SecurityWeek |
| Azure DDoS Protection (Oct 2025) — cloud record | 15.7 Tbps | Microsoft / SecurityAffairs |
| Cloudflare (May 2025) — 7.3 Tbps | 7.3 Tbps | Cloudflare |
| Mirai botnet (Q4 2024) — 5.6 Tbps | 5.6 Tbps | Cloudflare |
| Record packet rate (Q1 2025) — 4.8 Bpps | 4.8 Bpps | Cloudflare |
| Global Secure Layer — 3.15 Bpps packet record | 3.15 Bpps | Global Secure Layer |
| Previous bandwidth record (Oct 2024) — 3.8 Tbps | 3.8 Tbps | Cloudflare |
DDoS Record Timeline: The Escalation
How DDoS attack records scaled from 3.8 Tbps to 31.4 Tbps in just 14 months. Click a bar for details.
Nathan House's Analysis: ${recordGrowth}% Bandwidth Growth in 14 Months
In October 2024, the DDoS bandwidth record stood at 3.8 Tbps. By December 2025, it reached 31.4 Tbps — an ${recordGrowth}% increase in just 14 months. Cross-referencing the timeline: 3.8 Tbps (Oct 2024) to 5.6 Tbps (Q4 2024) to 7.3 Tbps (May 2025) to 15.7 Tbps (Oct 2025) to 31.4 Tbps (Dec 2025). Each new record stood for weeks, not years. The arms race between botnets and mitigation providers is accelerating faster than at any point in DDoS history.
Bandwidth Records (Tbps)
- 31.4 Tbps — Aisuru botnet (Dec 2025)
- 22.2 Tbps — Unnamed (2025)
- 15.7 Tbps — Azure cloud record (Oct 2025)
- 7.3 Tbps — Cloudflare (May 2025)
Packet Rate Records (Bpps)
- 10.6 Bpps — With 22.2 Tbps attack
- 4.8 Bpps — Cloudflare Q1 2025
- 3.15 Bpps — Global Secure Layer
- 3.64 Bpps — Azure Oct 2025
🛠 Types of DDoS Attacks
16.8 million network-layer (L3/L4) attacks in Q1 2025 (Cloudflare). Application-layer (L7) attacks rose 74% year over year in Q2 2025. The shift toward L7 is strategic: as network-layer defenses improve, attackers move to application-layer attacks that mimic legitimate traffic and slip past volumetric filters.
| Finding | Value | Source |
|---|---|---|
| Network-layer (L3/L4) attacks (Q1 2025) | 16.8 million | Cloudflare |
| HTTP (L7) attack increase YoY | 118% | Cloudflare |
| Application-layer DDoS increase (Q2 2025) | 74% | Cloudflare |
| L3/L4 attacks under 1 Gbps | 99% | Cloudflare |
| CLDAP amplification spike (QoQ) | 3,488% | Cloudflare |
| Web DDoS attacks under 100K RPS | 94.4% | Radware |
| Application/API attack increase YoY | 128% | Radware |
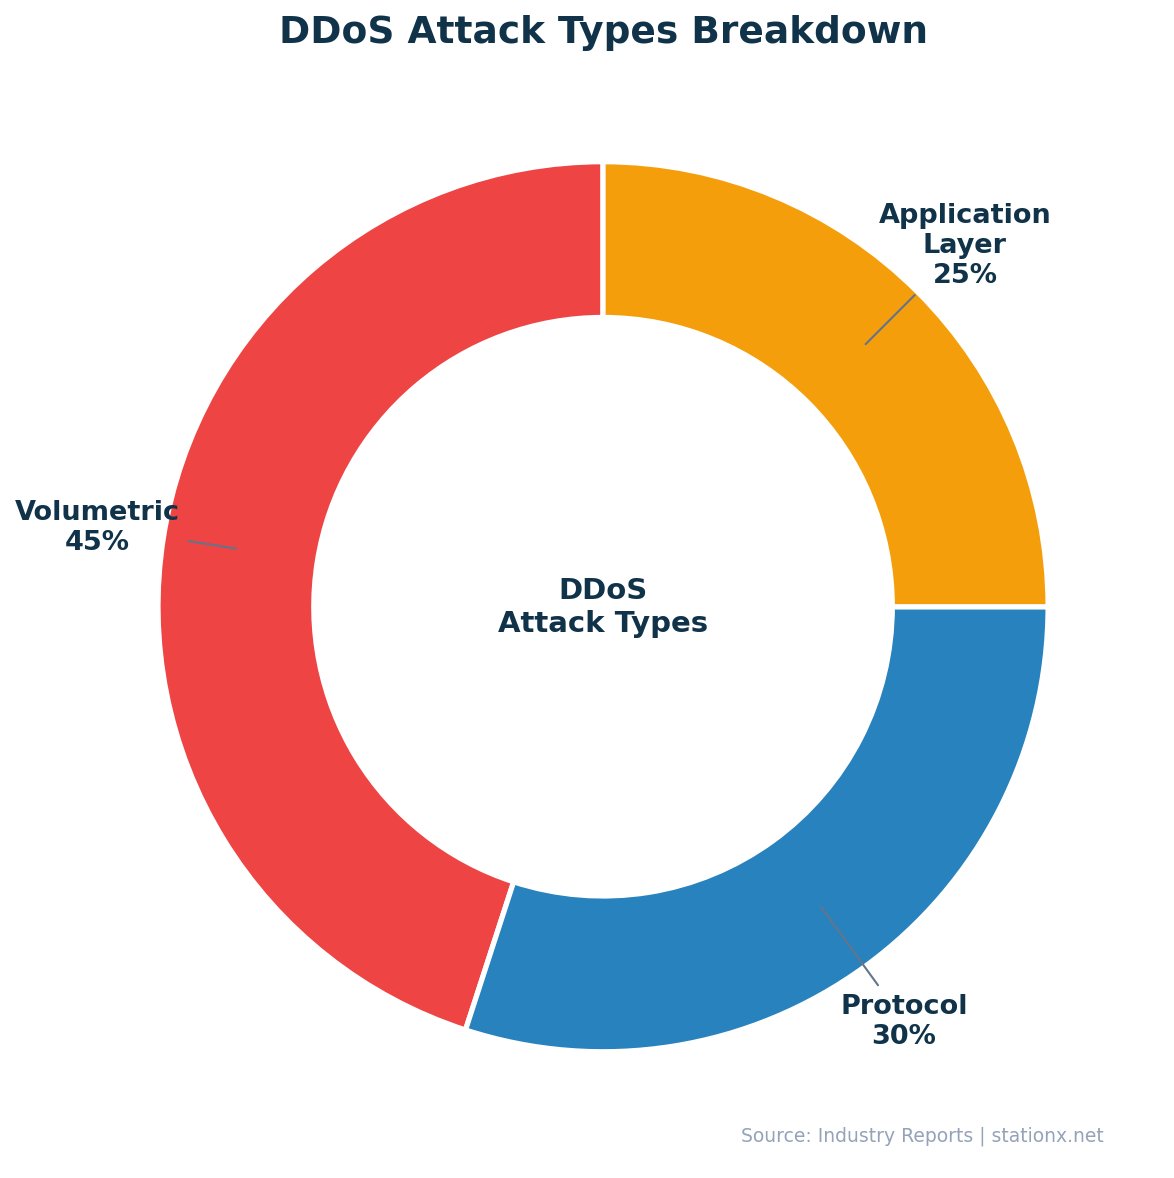
Three main DDoS attack categories dominate the landscape:
Volumetric
Overwhelm bandwidth with massive traffic floods. SYN floods remain the most common vector. 99% of L3/L4 attacks are under 1 Gbps — but the top 1% now reach 31.4 Tbps.
Protocol
Exploit protocol weaknesses to exhaust server resources. CLDAP amplification attacks surged 3,488% QoQ in Q1 2025 (Cloudflare). DNS flood attacks are the second most common vector.
Application-Layer
Target specific services with legitimate-looking requests. L7 attacks rose 74% YoY (Q2 2025). 94.4% of web DDoS are under 100K RPS — small enough to evade traditional detection.
The Stealth Shift: 94.4% of Web DDoS Fly Under the Radar
Radware reports 94.4% of web DDoS attacks measure under 100,000 requests per second. These are not the headline-grabbing Tbps assaults. They are small, persistent floods designed to slip past detection thresholds. Cross-referencing with Cloudflare's finding that 99% of L3/L4 attacks are under 1 Gbps, the picture is clear: the median DDoS attack is tiny. The dangerous ones are the outliers — and those outliers are getting exponentially larger.
🏭 DDoS Attacks by Industry
Telecommunications and education each claimed 24% of DDoS attacks in 2025 (Zayo). The biggest shift: telecom's share dropped from 42% to 24%, while education jumped from 15% to 24%. Attackers are diversifying targets. Manufacturing faces the largest average attack size at 11.6 Gbps.
| Finding | Value | Source |
|---|---|---|
| Telecommunications (down from 42%) | 24% | Zayo |
| Education (up from 15%) | 24% | Zayo |
| Government (up from 5%) | 12% | Zayo |
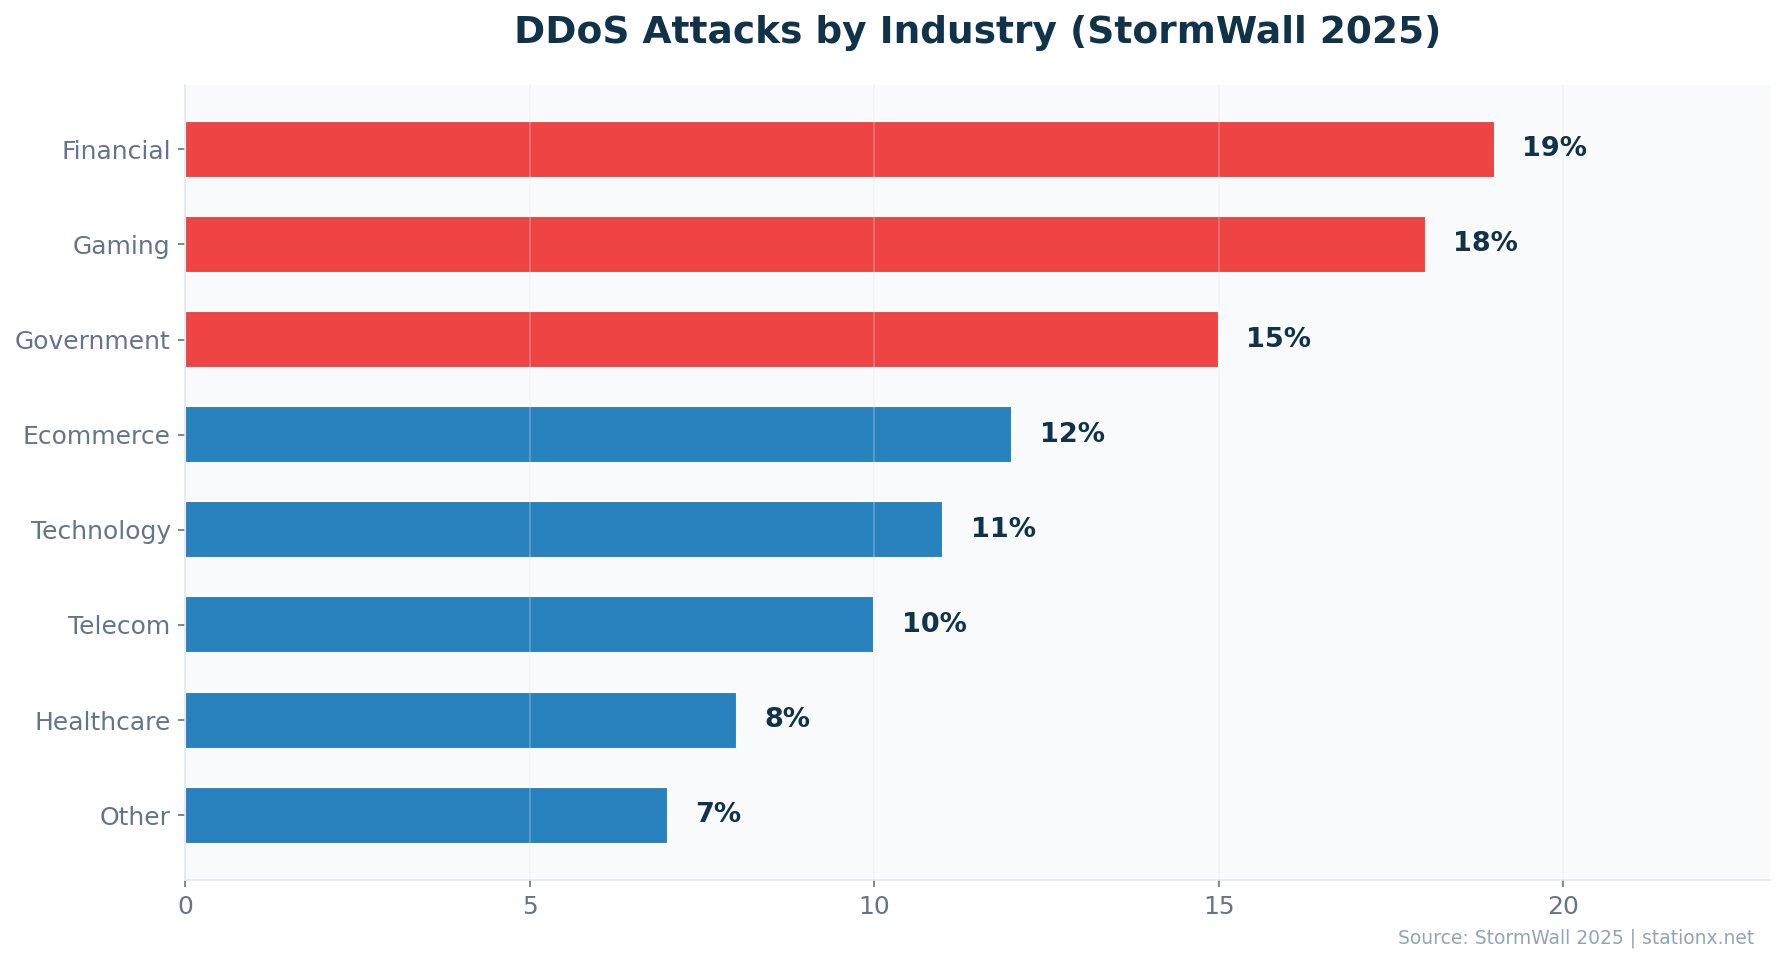
| Financial services | 19% | StormWall |
| Gaming & gambling (down from 34%) | 19% | Gcore |
| Technology (network-layer attacks) | 45% | Cloudflare |
| Manufacturing (avg attack size) | 11.6 Gbps | Zayo |
| Financial services DDoS growth YoY | 83% | StormWall |
| Average attack size growth YoY | 70% | Zayo |
DDoS Industry Risk Profile
Select an industry to see its DDoS attack profile based on Zayo, StormWall, and Gcore data.
Nathan House's Analysis: Education Is the New Soft Target
Zayo reports education jumped from 15% to 24% of all DDoS attacks in 2025, with 45% of those attacks hitting in April and May during peak academic periods. Meanwhile, gaming dropped from 34% to 19% as improved defenses pushed attackers to softer targets. Cross-referencing with Stormwall data showing financial services DDoS grew 83% year over year, the pattern is clear: attackers follow the path of least resistance. Education and government sectors with smaller security budgets are bearing the brunt.
💰 DDoS Attack Duration & Cost
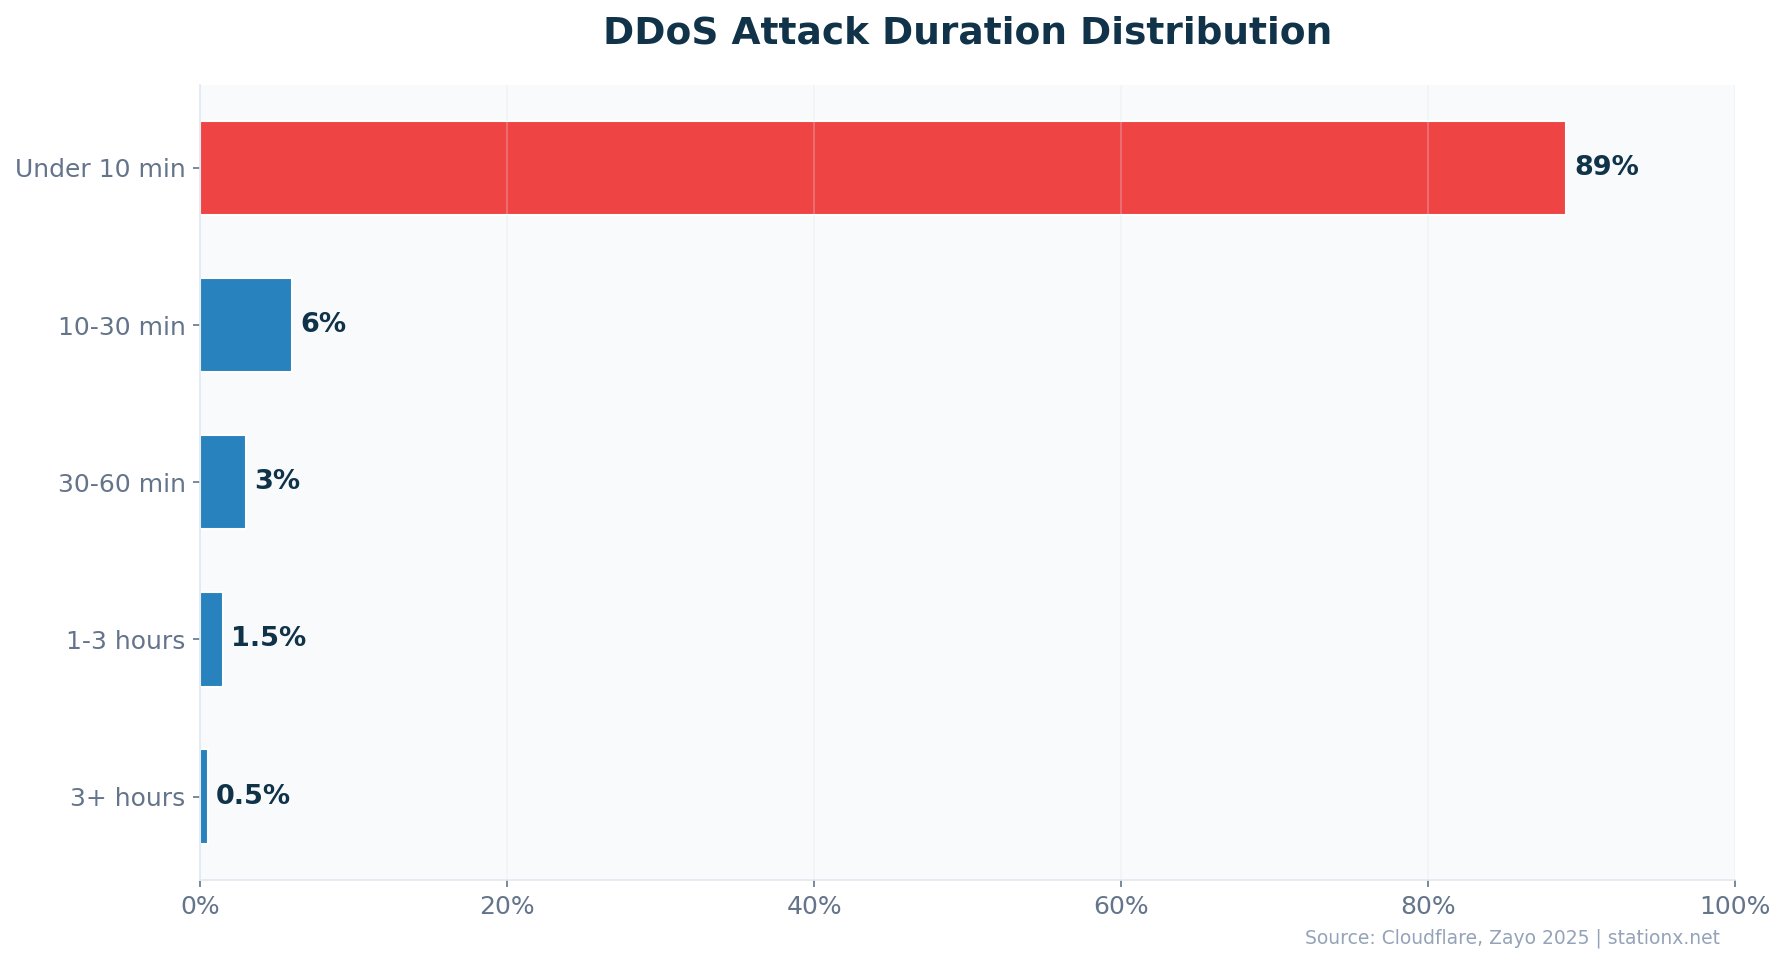
89% of DDoS attacks now last under 10 minutes (Cloudflare/Zayo). The average dropped to 20 minutes, down from 39 minutes the prior year. Short does not mean cheap — every minute of downtime costs an average of $22,000 (MazeBolt). A 30-minute outage for a mid-market company costs roughly $660,000.
| Finding | Value | Source |
|---|---|---|
| Average attack duration (2025) | 20 minutes | Zayo / Industry Reports |
| Attacks lasting under 10 minutes | 89% | Cloudflare / Zayo |
| Duration of 31.4 Tbps record attack | 35 seconds | Bleeping Computer |
| Cost per minute of downtime | $22,000 | MazeBolt |
| SMB average recovery cost | $120,000 | Corero / Industry Reports |
| Enterprise financial loss potential | $1 million+ | Corero / Industry Reports |
| DDoS-for-hire (booter) hourly cost | $38 | Imperva / FastNetMon |
DDoS Downtime Cost Calculator
Estimate the financial impact of a DDoS attack on your organisation based on attack duration and company size.
Nathan House's Analysis: The $38 vs $120,000 Asymmetry
A DDoS-for-hire (booter) service costs $38/hour (Imperva). The average SMB recovery cost from a DDoS attack is $120,000 (Corero). That is a 1:${attackerCostRatio} attacker-to-defender cost ratio. For large enterprises, losses exceed $1 million. This is one of the most asymmetric cost ratios in cybersecurity — an attacker with pocket change can inflict six-figure damage. Proactive DDoS mitigation is not a cost, it is a fraction of the alternative.
Cost to Attack
- $38/hour — DDoS-for-hire service
- $20/day — Basic booter subscription
- No technical skill required
- AI chatbots lower barrier further
Cost to Defend
- $120,000 — SMB recovery cost
- $1M+ — Enterprise losses
- $22,000 per minute of downtime
- $5.8B — Global protection market
🌎 DDoS and Geopolitics
Europe absorbed 48.4% of all claimed DDoS attacks in 2025 (Radware). Israel was the most targeted country at 12.2%, followed by the United States (9.4%) and Ukraine (8.9%). DDoS has become a primary weapon of digital warfare — NoName057(16) alone claimed 4,693 attacks in 2025.
| Finding | Value | Source |
|---|---|---|
| Europe's share of claimed attacks | 48.4% | Radware |
| Israel (most targeted country) | 12.2% | Radware |
| United States | 9.4% | Radware |
| Ukraine | 8.9% | Radware |
| Government services targeted | 38.8% | Radware |
| NoName057(16) claimed attacks | 4,693 | Radware |
| DDoS surge after Israel-Iran escalation | 800% | TeckPath |
| US election DDoS requests mitigated | 6 billion+ | Cloudflare |
Nathan House's Analysis: DDoS as Digital Warfare
Three geopolitical conflicts dominate the DDoS landscape: Russia-Ukraine, Israel-Iran, and India-Pakistan. Cross-referencing Radware (government services = 38.8% of hacktivist targets) with the 800% DDoS surge following the June 2025 Israel-Iran escalation, and Cloudflare's 6 billion+ requests mitigated targeting US election websites in November 2024, the evidence is unambiguous: DDoS is a state-level weapon. The 4,693 attacks claimed by NoName057(16) alone exceed the annual output of most cybercrime groups.
Election Infrastructure Under Siege
Cloudflare mitigated over 6 billion HTTP DDoS requests targeting US election websites on October 31 and November 1, 2024 alone. Following Israeli airstrikes on Iran in June 2025, hacktivist groups launched an 800% DDoS surge against US businesses within 24 hours. Territorial disputes drove nearly two-thirds of all observed cyber activity in 2025.
🛡 DDoS Protection Market & Mitigation
$5.80 billion — that is the current DDoS protection market (MarketsandMarkets 2025). It is projected to reach $10.39 billion by 2030, a 79% total increase at 12.3% CAGR. The growth tracks the threat: as attacks double year over year, so does the mitigation spending.
| Finding | Value | Source |
|---|---|---|
| DDoS protection market (2025) | $5.80 billion | MarketsandMarkets |
| Projected market size (2030) | $10.39 billion | MarketsandMarkets |
| Market CAGR (2025-2030) | 12.3% | MarketsandMarkets |
| Attacks forecast for 2026 | 58 million | StormWall |
| DDoS weapons tracked globally | 12.3 million | A10 Networks |
12.3 Million DDoS Weapons Ready to Fire
A10 Networks tracks 12.3 million DDoS weapons (attack-capable systems) worldwide. StormWall forecasts it will mitigate 58 million attacks in 2026 — nearly three times more than in 2025. The protection market growth is not speculative; it is a direct response to an exponentially growing threat.
🤖 AI and DDoS
AI is transforming both sides of the DDoS equation. On offense, AI-assisted DDoS-as-a-Service platforms let attackers prompt chatbots like GhostGPT with simple commands. On defense, NETSCOUT's Arbor suite processes 700+ Tbps of real-time traffic and neutralises 80% of attacks without human intervention.
| Finding | Value | Source |
|---|---|---|
| Real-time traffic data for AI mitigation | 700+ Tbps | NETSCOUT |
| Attacks auto-neutralised by AI defense | 80% | NETSCOUT |
| Hyper-volumetric attacks blocked (Q1 2025) | 700+ | Cloudflare |
| Small stealth DDoS attacks (evasion tactic) | 94.4% | Radware |
AI-Powered Attacks
- DDoS-as-a-Service with AI chatbots (GhostGPT, WormGPT)
- Attacks instantly adapt strategy mid-assault
- Switch between network layers to bypass filters
- 94.4% of web DDoS stay under detection thresholds
AI-Powered Defense
- 700+ Tbps of real-time traffic data analysed
- 80% of attacks neutralised without human intervention
- ML detects anomalies before traditional tools alert
- 700+ hyper-volumetric attacks blocked in Q1 2025
Nathan House's Analysis: AI Lowers Both Barriers
AI is democratising both DDoS attacks and DDoS defense simultaneously. On the attack side, services like GhostGPT let non-technical users launch sophisticated attacks with simple prompts. On the defense side, NETSCOUT reports 80% automatic mitigation. The question is whether AI-powered defense scales faster than AI-powered offense. Given that Cloudflare blocked 700+ hyper-volumetric attacks in Q1 2025 alone — attacks that would have been unmitigable five years ago — the defense side is holding. But the margin is thin.
💡 Key Takeaways
- 1. Volume is compounding, not spiking. 20.5 million attacks in Q1 2025. 47.1 million for the full year. Radware customers face 139 attacks per day. This is the new normal — not a temporary escalation.
- 2. Records are breaking monthly. The DDoS bandwidth record was broken at least five times in 2025, going from 3.8 Tbps to 31.4 Tbps in 14 months. Each new record lasted weeks, not years.
- 3. Short attacks, massive damage. 89% last under 10 minutes, but at $22,000 per minute, even a brief outage costs six figures. The 31.4 Tbps record attack lasted just 35 seconds.
- 4. The cost asymmetry is extreme. $38 to attack. $120,000+ to recover. Proactive mitigation is orders of magnitude cheaper than incident response.
- 5. Geopolitics drives volume. DDoS is now a primary weapon in nation-state conflicts. Israel, the US, and Ukraine are the top targets. Elections, diplomatic crises, and military actions all trigger attack surges.
- 6. Industry targeting is shifting. Education and government are the new growth targets. Gaming and telecom defenses improved, so attackers moved to sectors with weaker protection.
- 7. AI is the force multiplier on both sides. AI-powered attacks adapt mid-assault. AI-powered defense neutralises 80% automatically. The arms race is accelerating — and whoever scales AI faster wins.
❓ Frequently Asked Questions
How many DDoS attacks happen per day?
What is the largest DDoS attack ever recorded?
How much does a DDoS attack cost a business?
Which industries are most targeted by DDoS attacks?
How long does a typical DDoS attack last?
What are the three main types of DDoS attacks?
About This Data
This article draws from 52 statistics aggregated from 50+ authoritative sources including IBM Cost of a Data Breach, Verizon DBIR, CrowdStrike Global Threat Report, WEF Global Cybersecurity Outlook, FBI IC3, ISC2 Cybersecurity Workforce Study, Sophos, Gartner, Mandiant M-Trends, and Ponemon Institute reports.
Derived statistics (marked "Nathan House's Analysis") are computed by cross-referencing data from multiple sources — for example, comparing breach costs across industries using IBM data, or validating ransomware trends across Verizon, Sophos, and HIPAA Journal findings.
All statistics include inline source citations with links to primary sources. Data spans 2023-2026, with preference given to the most recent available figures. Last updated: June 2026.
Related Statistics
About the Author

Nathan House, Founder & CEO of StationX
Nathan House has 30 years of hands-on cybersecurity experience and is Cambridge-educated, holding CISSP, CISA, CISM, OSCP, CEH, and SABSA. He founded StationX in 1999 — one of the UK’s first cybersecurity companies — and has secured £71 billion in UK mobile banking transactions and the London 2012 Olympics, advising clients including Microsoft, Cisco, BP, Vodafone, and VISA. He authored the world’s most popular cybersecurity course — a #1 Udemy bestseller taken by over 500,000 students — and was named Cyber Security Educator of the Year 2020, AI Security Educator of the Year, and a UK Top 25 Security Influencer 2025. A DEF CON speaker and featured expert on CNN, Fox News, NBC, and the BBC, Nathan leads StationX’s training of more than half a million students worldwide.