Cybersecurity Market Size [2026]: Growth & Country Data

The global cybersecurity market hit $218.98 billion in 2026 (Fortune Business Insights). At a 13.8% CAGR, it is projected to reach $699.39 billion by 2034. The United States alone commands $87.42 billion of that total — roughly 40% of the world's cybersecurity spend — while Gartner projects end-user security spending will reach $240 billion by 2026.
You will find 79+ cybersecurity industry statistics across 12 categories covering cybersecurity market size 2026 projections, regional breakdowns, spending trends, market segments, vendor revenue, and VC investment. Each section includes original analysis and cybersecurity market forecast data cross-referencing Gartner, Fortune Business Insights, MarketsandMarkets, Mordor Intelligence, and 20+ other authoritative sources.
Key Takeaways
- The global cybersecurity market is worth $218.98 billion in 2026 and is projected to reach $699.39 billion by 2034 (Fortune BI)
- Gartner forecasts end-user security spending at $213 billion in 2026, growing 15% YoY
- The United States leads with $87.42 billion — roughly 40% of the global market (Precedence Research)
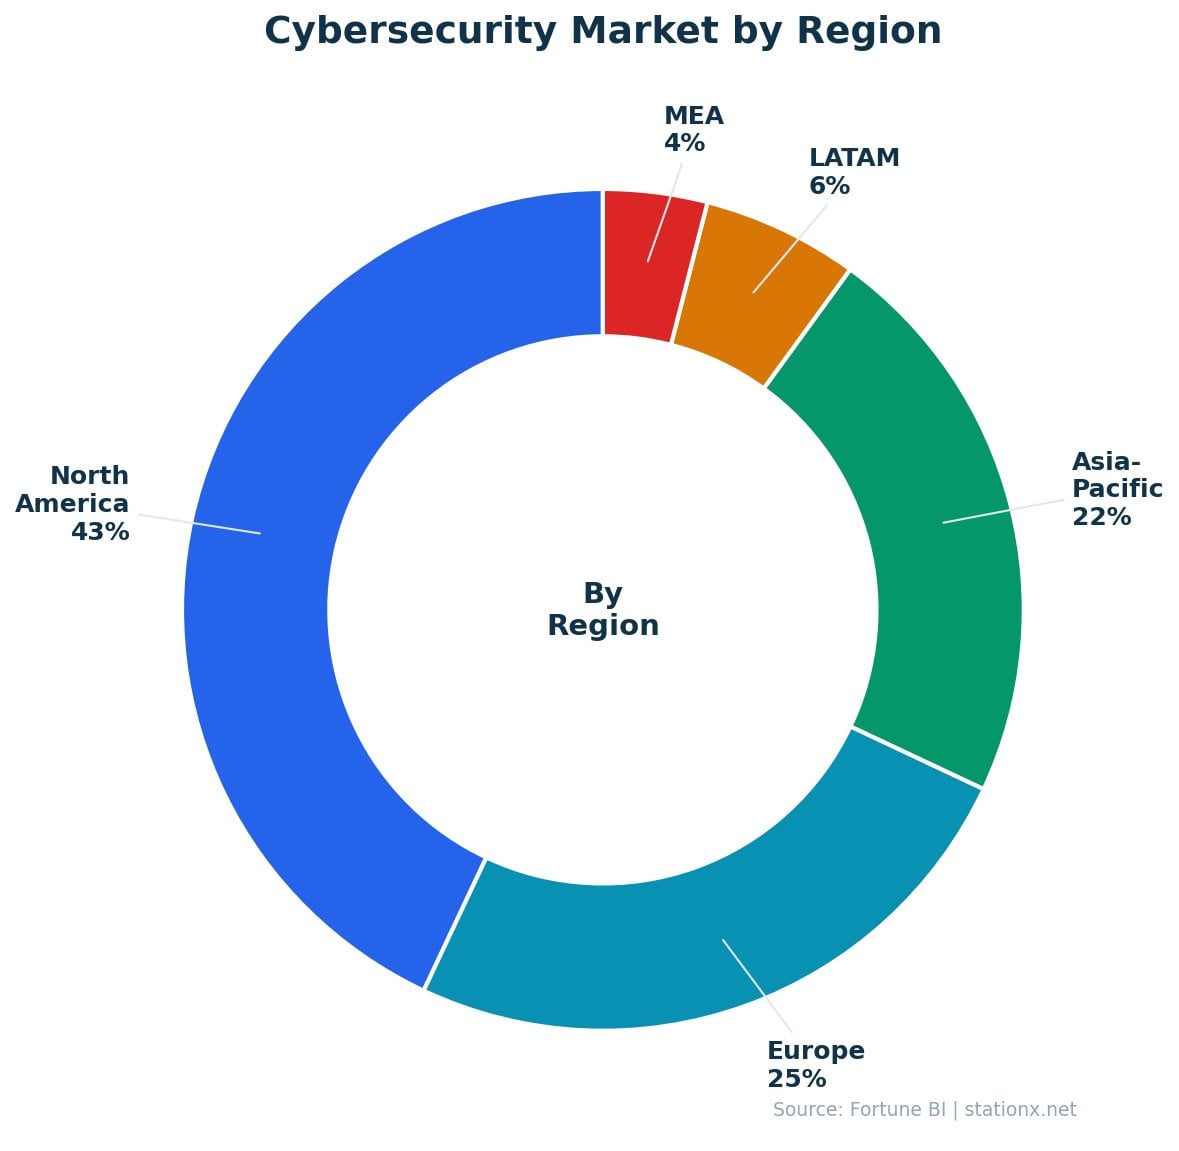
- North America holds 43% market share, followed by Europe at 25.6% and APAC at 20.7%
- Cybersecurity VC funding hit $14 billion in 2025 across 392 rounds — up 47% YoY (SecurityWeek)
- The MDR segment is the fastest-growing at 21.95% CAGR (Mordor Intelligence)
- Cloud deployment captures 54.59% of the cybersecurity market, growing at 15.26% CAGR
- 99% of organizations plan to increase their cybersecurity budget (PwC)
Last updated: June 2026
📊 Key Cybersecurity Market Numbers
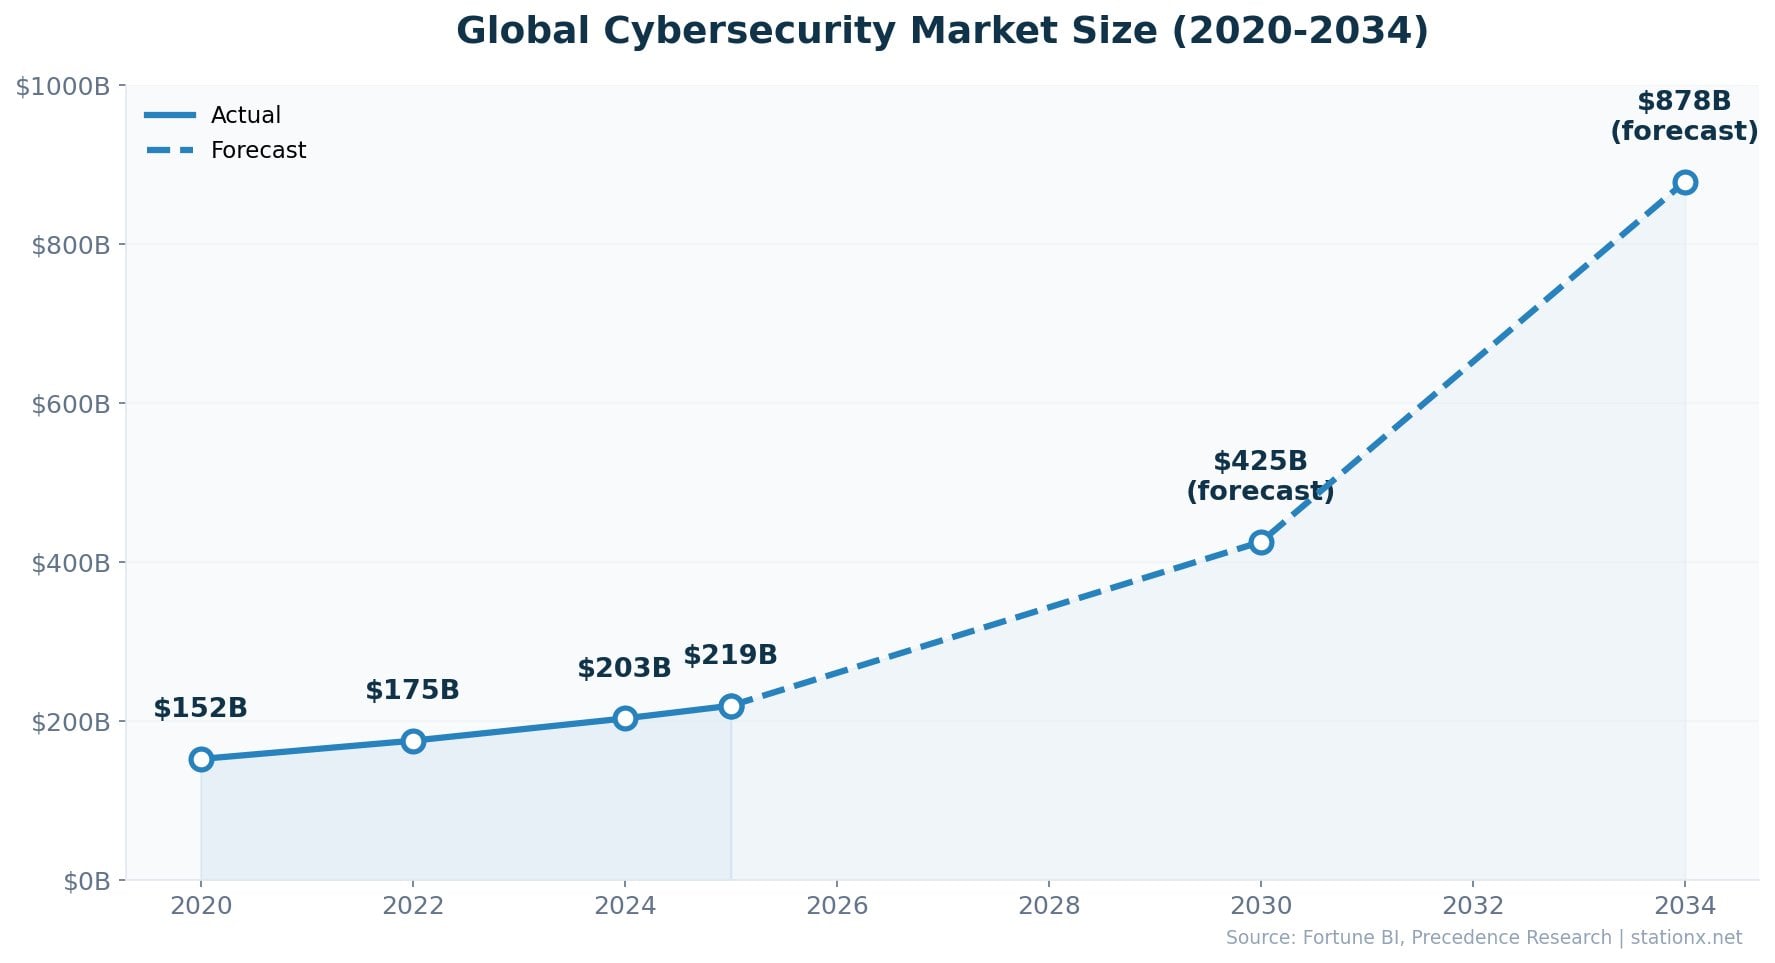
$218.98 billion — that is the size of the global cybersecurity market in 2026 (Fortune Business Insights). The market grew 44% from $152 billion in 2020, and at the current 13.8% CAGR, it doubles every 5.4 years.
| Finding | Value | Source |
|---|---|---|
| Global cybersecurity market size (2025) | $218.98B | Fortune Business Insights |
| Projected global market size (2034) | $699.39B | Fortune Business Insights |
| Market CAGR 2026-2034 | 13.8% | Fortune Business Insights |
| Gartner: end-user security spending (2025) | $213B | Gartner |
| Gartner: projected spending (2026) | $240B | Gartner |
| North America market share | 43% | Fortune Business Insights |
| Global market (Precedence Research) | $227.59B | Precedence Research |
| 2034 forecast (Precedence Research) | $878.48B | Precedence Research |
| CAGR (Precedence Research) | 12.6% | Precedence Research |
| 2030 forecast (MarketsandMarkets) | $351.92B | MarketsandMarkets |
| 2030 forecast (Grand View Research) | $424.97B | Grand View Research |
| VC investment in cybersecurity (2025) | $14B | SecurityWeek |
Nathan House's Analysis: Forecast Divergence
Four major research firms project the 2030 market between $351.92B (MarketsandMarkets, 9.1% CAGR) and $500.70B (Grand View Research, 12.9% CAGR) — a 42% gap. The variance comes down to scope: MarketsandMarkets excludes adjacent categories like managed services that Grand View includes. For planning purposes, the midpoint of roughly $425B by 2030 is a reasonable working estimate, but track definitions carefully when citing any single source.
The cybersecurity market outpaces overall IT spending growth. While Gartner projects total IT spending to grow 9.8% in 2026, security spending grows 12.5% — reflecting how organizations are allocating a larger share of IT budgets to defense. Precedence Research projects the most aggressive long-term trajectory, reaching $878.48B by 2034 at a 12.6% CAGR.
📈 Cybersecurity Market Growth Trajectory
$152 billion in 2020. $218.98 billion in 2026. $699.39 billion by 2034. The cybersecurity market has grown at double-digit rates for five consecutive years, accelerated by remote work, cloud migration, and escalating threat sophistication. The COVID-19 pandemic in 2020 catalyzed a permanent shift in enterprise security architecture.
| Finding | Value | Source |
|---|---|---|
| Global market size (2020) | $152.0B | Fortune Business Insights |
| Global market size (2021) | $173.0B | Fortune Business Insights |
| Global market size (2022) | $186.0B | Fortune Business Insights |
| Global market size (2023) | $193.0B | Fortune Business Insights |
| Global market size (2024) | $218.98B | Fortune Business Insights |
| Global market size (2025) | $218.98B | Fortune Business Insights |
| Projected market size (2026) | $248.28B | Fortune Business Insights |
| Projected market size (2034) | $699.39B | Fortune Business Insights |
| CAGR 2026-2034 (Fortune BI) | 13.8% | Fortune Business Insights |
| CAGR 2025-2034 (Precedence) | 12.6% | Precedence Research |
| CAGR 2025-2030 (MarketsandMarkets) | 9.1% | MarketsandMarkets |
Nathan House's Analysis: The $67B Annual Growth
The market is adding roughly $67 billion in new value every year. To put that in perspective, the entire cybersecurity market in 2020 ($152B) is smaller than the projected growth increment between 2025 and 2026 alone. This acceleration is structural, not cyclical — regulation (NIS2, DORA, SEC disclosure rules), AI-driven threats, and cloud complexity are permanent demand drivers. Organizations that view security spending as discretionary are shrinking every year.
Multiple sources confirm this trajectory. MarketsandMarkets projects $351.92B by 2030 using a conservative 9.1% CAGR that focuses on core security products. Grand View Research reaches $500.70B by 2030 with a 12.9% CAGR that includes a broader scope of security services. Precedence Research's 12.6% CAGR projection lands at $878.48B by 2034 — nearly 4x today's market.
Conservative Estimates (2030)
- MarketsandMarkets: $351.92B (9.1% CAGR)
- BCC Research: $396.8B (11.6% CAGR)
- Narrower scope: core security products
Aggressive Estimates (2030)
- Grand View Research: $500.70B (12.9% CAGR)
- Mordor Intelligence: $424.97B
- Broader scope: includes managed services
Historical Growth Context
The cybersecurity market has grown at double-digit rates for five consecutive years. From $152B in 2020 to $218.98B in 2026, the market added $67 billion in new value. That is roughly the entire size of the cloud computing market a decade ago. The COVID-19 pandemic accelerated remote work adoption, which permanently expanded the enterprise attack surface and created lasting demand for Zero Trust, SASE, and cloud security solutions.
Three distinct growth phases are visible in the data. Phase 1 (2020-2021): Pandemic-driven emergency spending on remote access security, VPN, and endpoint protection. Phase 2 (2022-2023): Consolidation around cloud-native platforms and regulatory preparation (GDPR fines escalated, NIS2 adopted). Phase 3 (2024-present): Structural acceleration driven by AI threats, mandatory breach disclosure, and board-level accountability for cybersecurity. Each phase built on the previous, creating a compounding growth dynamic.
The market's resilience during the 2022-2023 tech downturn is notable. While overall tech VC funding dropped 35%+ and many SaaS companies faced growth deceleration, cybersecurity spending continued growing at 12-15% annually. Security is now treated as non-discretionary infrastructure spending — closer to electricity than to marketing software. This countercyclical behavior is one reason analysts project sustained double-digit growth through 2034.
Nathan House's Analysis: Three Growth Phases
The market data reveals three distinct growth phases since 2020. Phase 1 (pandemic, 2020-2021): emergency spending drove $21B in new market value. Phase 2 (consolidation, 2022-2023): regulatory preparation and platform adoption drove $20B. Phase 3 (acceleration, 2024+): AI threats, mandatory disclosure, and board accountability are now driving $25B+ annually. Each phase builds on the previous, creating a compounding dynamic. Organizations that invested in Phase 1 are now upgrading; those that delayed are catching up at higher cost. This is why 99% of organizations plan to increase budgets (PwC) — the late movers are being forced by regulation and insurance.
🌍 Cybersecurity Market Size by Country
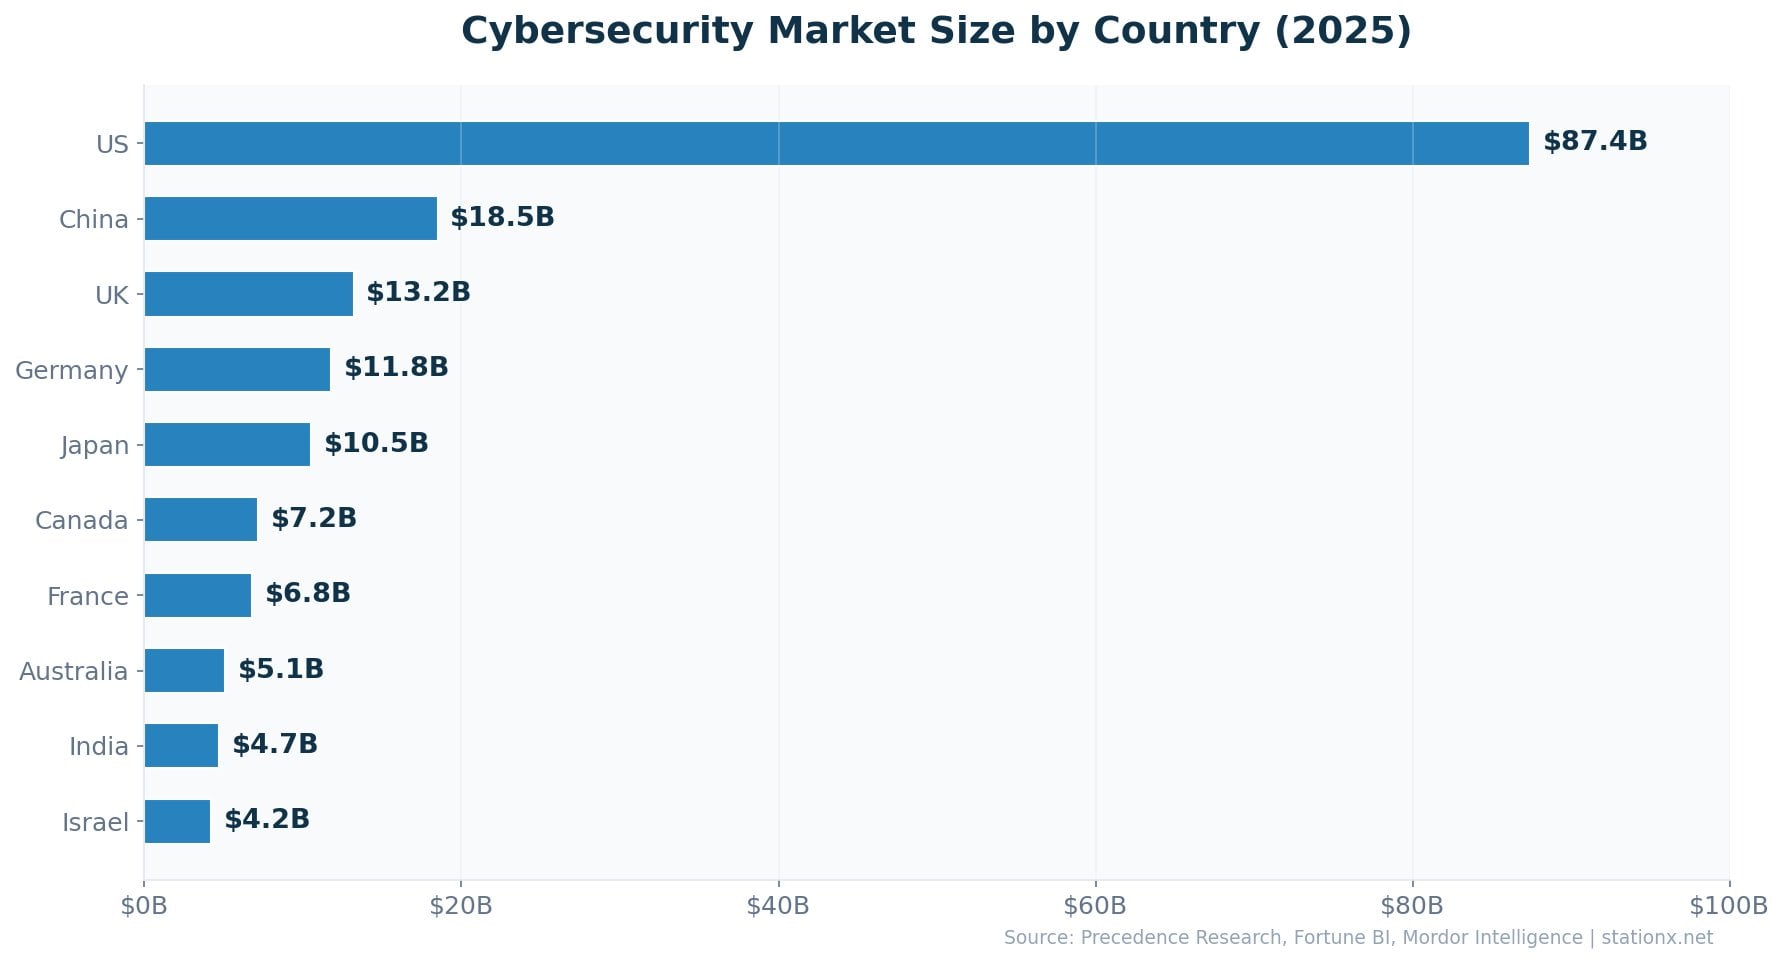
The United States dominates with $87.42 billion in cybersecurity spending — 39.9% of the global market despite having just 4.2% of the world's population. That is $257 per capita, dwarfing every other nation. China follows at $13.03B, but the gap between the two reflects both market maturity and regulatory differences.
| Finding | Value | Source |
|---|---|---|
| United States (2025) | $87.42B | Precedence Research |
| United Kingdom (2026) | $11.55B | Fortune Business Insights |
| Germany (2026) | $11.36B | Fortune Business Insights |
| France (2026) | $7.97B | Fortune Business Insights |
| Japan (2026) | $11.13B | Fortune Business Insights |
| China (2026) | $13.03B | Fortune Business Insights |
| India (2026) | $8.92B | Fortune Business Insights |
| Australia (2025) | $8.40B | Mordor Intelligence |
| Canada (2025) | $4.23B | Statista |
| Israel (2025) | $1.86B | Grand View Research |
| Singapore (2025) | $1.80B | Statista / Industry Estimates |
| Brazil (2025) | $3.68B | Grand View Research |
| South Korea (2025) | $3.10B | Grand View Research |
| UAE (2025) | $0.85B | Mordor Intelligence |
Nathan House's Analysis: The US Dominance Gap
The US cybersecurity market ($87.42B) is 6.7x larger than China's ($13.03B), the second-largest market. Cross-referencing with Statista and population data, the US spends $257 per capita on cybersecurity vs approximately $9 per capita in China and $7 per capita in India. This gap reflects regulatory maturity (SEC disclosure rules, state breach notification laws), insurance requirements, and the concentration of Fortune 500 headquarters. The markets closing the gap fastest are India (16% CAGR) and Australia (18.4% CAGR).
Explore Cybersecurity Market by Country
Select a country to see its market size, growth rate, and key drivers.
The US leads global cybersecurity spending driven by SEC disclosure rules, state breach notification laws, and the world's highest concentration of enterprise IT. Key vendors: Palo Alto Networks, CrowdStrike, Fortinet, Zscaler.
Country-by-Country Breakdown
🇺🇸 United States — $87.42B
The world's largest cybersecurity market by a wide margin. SEC cybersecurity disclosure rules (effective December 2023), 50 state breach notification laws, and the concentration of Fortune 500 headquarters drive sustained demand. The US is home to Palo Alto Networks, CrowdStrike, Fortinet, and Zscaler — four of the top five pure-play vendors globally. Federal spending (CISA budget, DoD cyber operations) adds billions in government demand.
🇨🇳 China — $13.03B
China's market is shaped by three landmark laws: the Cybersecurity Law (2017), Data Security Law (2021), and Personal Information Protection Law (PIPL, 2021). State-driven investment focuses on critical infrastructure protection and data sovereignty. Growth is driven by the country's digital economy transformation and domestic vendor development (Huawei, Sangfor, Qi-Anxin). The government's "data localization" requirements create a distinct market dynamic from the West.
🇬🇧 United Kingdom — $11.55B
Europe's largest cybersecurity market. The National Cyber Security Centre (NCSC) coordinates national defense, and the UK Cyber Security Strategy drives public and private investment. London is a global cybersecurity talent hub with premium salaries. The UK's financial services sector (one of the world's largest) is a major demand driver, with FCA and PRA regulations mandating operational resilience.
🇩🇪 Germany — $11.36B
Germany's cybersecurity investment is fueled by its manufacturing base (Industrie 4.0), BSI regulation, and NIS2 compliance requirements. OT security and automotive cybersecurity are unique growth drivers — Germany's auto industry (BMW, Mercedes, VW) faces increasing connected-vehicle security demands. The BSI (Federal Office for Information Security) sets national standards that influence enterprise spending.
🇯🇵 Japan — $11.13B
Japan's market reflects its advanced digital infrastructure and proximity to China-nexus threats. METI targets 3 trillion yen in domestic cybersecurity sales within a decade. The 2020 Tokyo Olympics catalyzed significant security investment.
🇮🇳 India — $8.92B
The fastest-growing major market at ~16% CAGR. Digital India initiatives, IT outsourcing growth, and CERT-In mandates drive demand. India faces 3,195 weekly attacks per organization — the highest rate globally (SentinelOne).
🇦🇺 Australia — $8.40B
High-profile breaches (Optus, Medibank in 2022) accelerated government action. The 2023-2030 Australian Cyber Security Strategy and mandatory breach reporting drive both public and private sector investment at 18.4% CAGR.
🇫🇷 France — $7.97B
France benefits from ANSSI (National Cybersecurity Agency) leadership and a growing domestic vendor ecosystem. The 2024 Paris Olympics drove significant security infrastructure investment. NIS2 transposition creates new compliance demand.
🇮🇱 Israel — $1.86B
38% of total Israeli tech investment flows into cybersecurity. Military intelligence units (Unit 8200) create an unmatched talent pipeline.
🇸🇬 Singapore — $1.80B
APAC's financial hub with Smart Nation initiatives and CSA (Cyber Security Agency) driving adoption across government and enterprise.
🇦🇪 UAE — $0.85B
Rapid digital transformation and Smart Dubai initiatives drive demand. Growing ~14% CAGR as the region modernizes critical infrastructure.
Nathan House's Analysis: Per-Capita Spending Reveals the Real Gap
Absolute market size masks a critical insight. The US spends $257 per capita on cybersecurity. The UK spends roughly $170 per capita. India spends approximately $6 per capita — yet faces the highest attack rate in the world at 3,195 weekly attacks per organization (SentinelOne). This per-capita gap is where the next wave of market growth will come from. India, Brazil, and the Middle East are underprotected relative to their threat exposure, and as regulation catches up (India's DPDP Act, Brazil's LGPD), spending will follow. The countries with the largest gap between attack volume and security investment are the ones with the highest growth potential.
🗺️ Cybersecurity Market by Region
North America commands 43% of the global cybersecurity market at $94.21 billion (Fortune Business Insights). Europe follows at $55.98B (25.6%), driven by GDPR, NIS2, and DORA compliance requirements. Asia-Pacific at $45.28B (20.7%) is the fastest-growing region, led by India, Australia, and Japan.
| Finding | Value | Source |
|---|---|---|
| North America (2025) | $94.21B | Fortune Business Insights |
| North America market share | 43% | Fortune Business Insights |
| Europe (2025) | $55.98B | Fortune Business Insights |
| Europe market share | 25.6% | Fortune Business Insights |
| Asia-Pacific (2025) | $45.28B | Fortune Business Insights |
| Asia-Pacific market share | 20.7% | Fortune Business Insights |
| Middle East & Africa (2025) | $16.72B | Fortune Business Insights |
| South America (2025) | $6.79B | Fortune Business Insights |
| APAC cyber market (FBI) | $45.28B | Fortune Business Insights |
Nathan House's Analysis: APAC Is the Growth Story
Asia-Pacific's cybersecurity market share (20.7%) understates its trajectory. APAC is growing 2.6 percentage points faster than North America annually — India at 16% CAGR, Australia at 18.4%. Cross-referencing Fortune BI and SentinelOne data, India faces 3,195 weekly attacks per organization (the highest globally) but spends a fraction of what the US spends per capita. This attack-to-spend mismatch is the strongest growth signal in the data. By 2030, APAC's share should surpass 25%.
The Middle East & Africa ($16.72B, 7.6% share) and South America ($6.79B, 3.1% share) are the smallest regions but growing from low bases. The GCC alone accounts for $6.92B, reflecting digital transformation across Saudi Arabia and the UAE. Latin America's growth is driven by Brazil ($3.68B), which faces increasing financial cybercrime.
Regional Growth Dynamics
North America ($94.21B)
Mature market with the highest spend per organization. Growth driven by SEC disclosure rules, CMMC requirements for defense contractors, and state-level privacy legislation (CCPA, CPRA). Federal CISA spending and critical infrastructure mandates add government demand. Enterprise platform consolidation (Palo Alto, CrowdStrike) is a defining trend.
Europe ($55.98B)
GDPR enforcement maturing into a compliance baseline. NIS2 (October 2024) expands security requirements to 160,000+ entities across 18 sectors. DORA (January 2025) mandates ICT risk management for financial services. The UK, Germany, and France account for ~55% of European spending. Strong growth in the Nordics and Benelux.
Asia-Pacific ($45.28B)
The fastest-growing region by CAGR. India (16%), Australia (18.4%), and Japan (14%) lead. China's market is shaped by data sovereignty requirements. The APAC region has the largest unfilled cybersecurity roles gap (ISC2 2024), creating demand for managed services. Singapore serves as the region's security operations hub.
MEA & Latin America ($23.51B)
Emerging markets with high growth potential. The GCC ($6.92B) drives MEA spending through Saudi Vision 2030 and UAE Smart Dubai. Africa and Latin America report the lowest cyber confidence levels (WEF). Brazil ($3.68B) faces rising financial cybercrime, driving regulatory response (LGPD). These regions represent the largest untapped market opportunity.
💰 Cybersecurity Spending Statistics
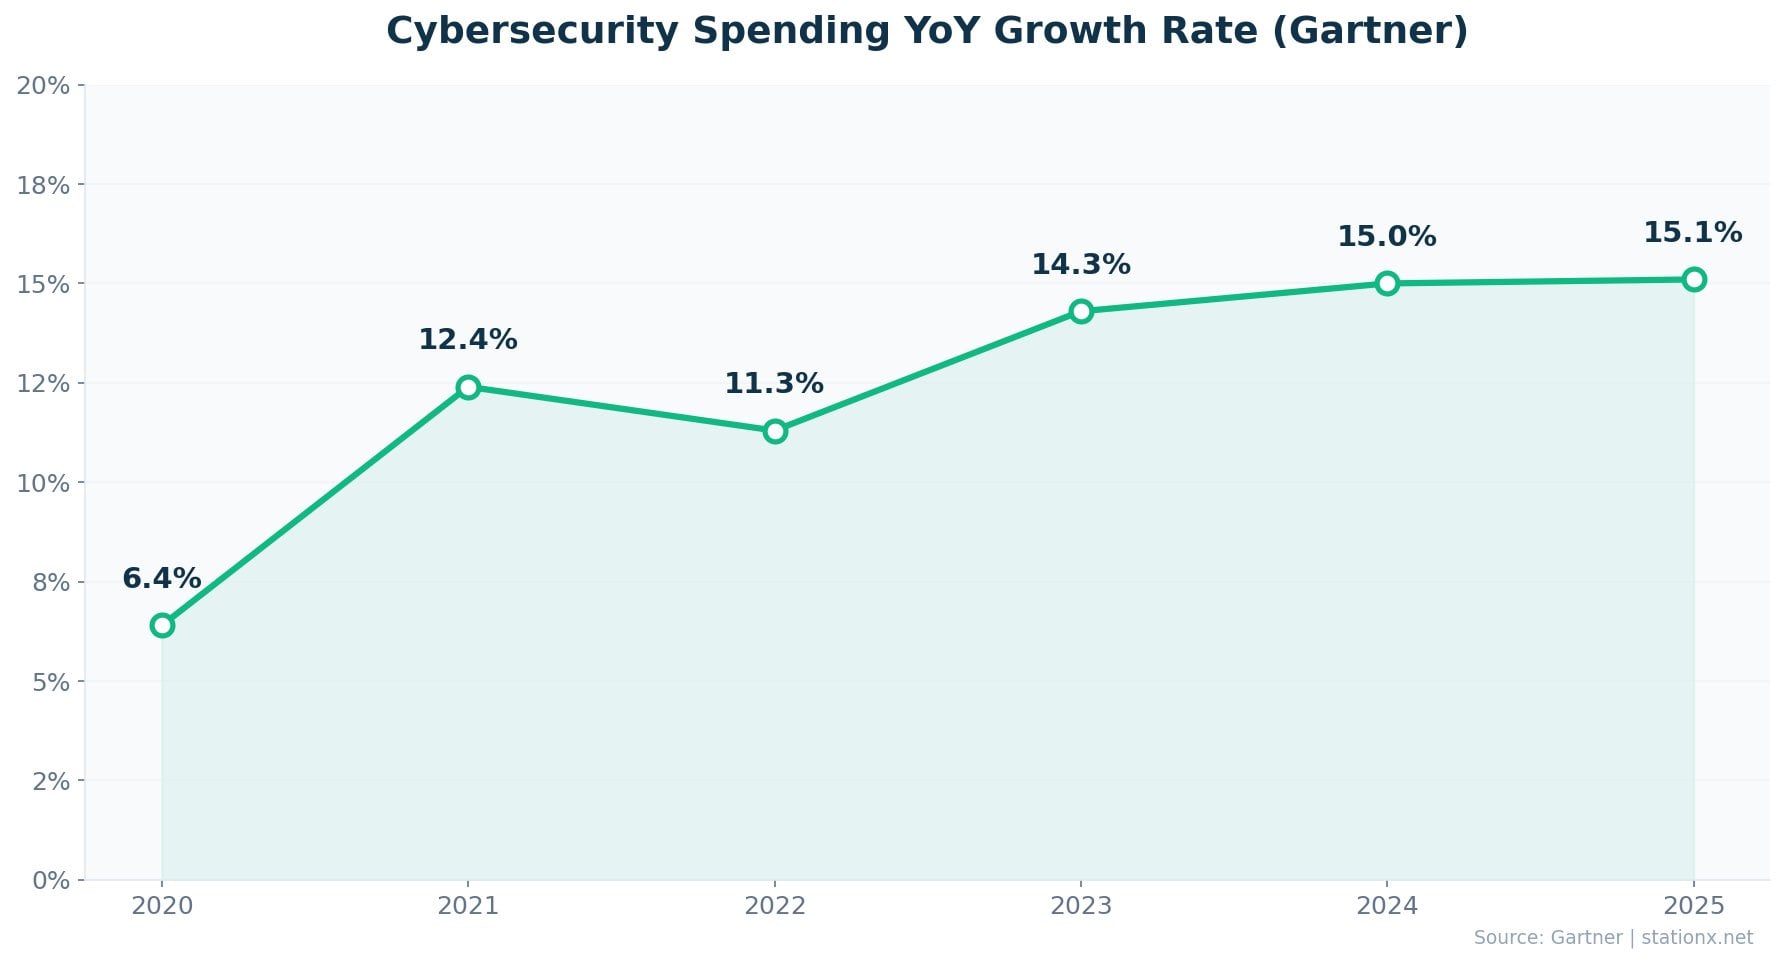
$213 billion — Gartner's 2026 forecast for global end-user security spending, up 15% from $193 billion in 2024 (Gartner). By 2026, that figure climbs to $240 billion, a 12.5% increase. IDC projects the trajectory continuing to $377 billion by 2028. The direction is one-way: virtually every organization on the planet is spending more on security.
| Finding | Value | Source |
|---|---|---|
| Gartner: end-user security spending (2025) | $213B | Gartner |
| Gartner: projected spending (2026) | $240B | Gartner |
| YoY growth (2024 to 2025) | 15% | Gartner |
| Projected YoY growth (2025 to 2026) | 12.5% | Gartner |
| Gartner: total security spending | $212B | Gartner |
| Gartner: total info-sec spending | $213B | Gartner |
| IDC: spending growth (2025) | 12.2% | IDC |
| IDC: projected spending by 2028 | $377B | IDC |
| IDC: total spending projection (2028) | $377B | IDC |
| Gartner: spending rise forecast | 15% | Gartner |
| Organizations planning to increase security spend | 49% | IBM Cost of a Data Breach Report 2025 |
| Average security spend per employee | $2,700 | Deloitte |
| Security as share of IT budget | 12% | Statista / VikingCloud |
| Organizations planning budget increases | 99% | PwC Digital Trust Insights 2025 |
Nathan House's Analysis: The 99% Signal
PwC's Digital Trust Insights survey found 99% of organizations plan to increase their cybersecurity budget. That is essentially unanimous — a signal I have not seen in 30 years of cybersecurity. Cross-referencing with IBM's data showing 49% of breached organizations specifically increase security spending post-breach, the market is being driven by both proactive and reactive investment. The average security spend per employee is $2,700 (Deloitte), with security consuming roughly 12% of total IT budgets (VikingCloud).
Security software is the fastest-growing spending category (Gartner), driven by cloud migration creating new risk surfaces. Cloud security posture management and cloud access security brokers are the primary growth drivers within the software segment. AI and generative AI — both in defense and as a threat vector — remain key spending catalysts through 2026.
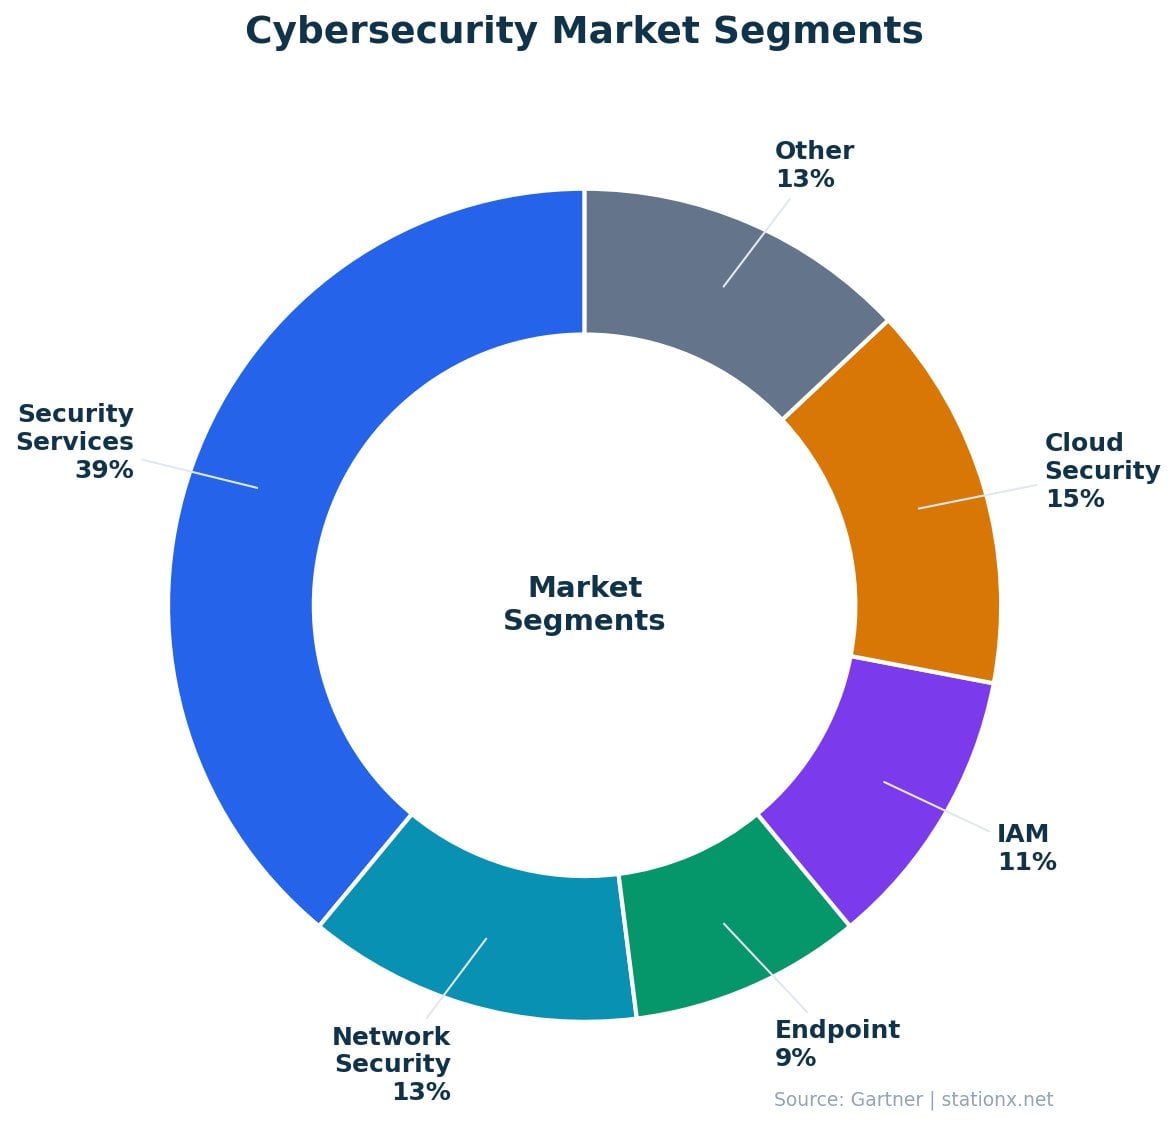
Where the Money Goes
Gartner's $213 billion end-user spending figure breaks down across four main categories. Security services leads at $86.1B (Gartner), reflecting the outsourcing trend as organizations struggle to staff internal SOCs. Network security ($29.1B) remains critical for distributed infrastructure. IAM ($24.1B) captures the largest product category share at 29.3% (Grand View Research), driven by Zero Trust adoption and identity-first security architectures.
The per-employee spend benchmark is $2,700 annually (Deloitte), with security consuming roughly 12% of total IT budgets (VikingCloud). These figures serve as useful baselines for security leaders building business cases, though they vary significantly by industry — financial services and healthcare spend considerably more, while retail and education typically spend less per employee.
Nathan House's Analysis: The Spending Acceleration Curve
Gartner's spending data reveals an acceleration pattern: 10% growth in 2022, 12% in 2023, 15.6% in 2024, and 15% in 2026. This is not a linear trend — it is a step-function increase that tracks directly with regulatory enforcement timelines (NIS2 in October 2024, DORA in January 2025, SEC rules in December 2023). The 2026 projection of 12.5% growth looks conservative given the current trajectory. When 99% of organizations tell PwC they plan to increase spending, the only question is by how much.
🧩 Cybersecurity Market Segments
Security services is the largest segment at $86.1 billion (Gartner), but the fastest-growing is MDR (Managed Detection & Response) at 21.95% CAGR (Mordor Intelligence). Cloud deployment already captures 54.59% of the cybersecurity market and is growing at 15.26% CAGR as enterprises shift workloads to multi-cloud environments.
| Finding | Value | Source |
|---|---|---|
| Security services market (2025) | $86.1B | Gartner |
| Network security market (2025) | $29.1B | Gartner |
| Endpoint security market (2025) | $27.46B | MarketsandMarkets |
| Endpoint protection (Gartner) | $19.1B | Gartner |
| IAM market (2025) | $24.1B | MarketsandMarkets / VikingCloud |
| IAM share of cybersecurity market | 29.3% | Grand View Research |
| Cloud-native app protection (CNAPP) | $10.90B | Mordor Intelligence |
| SIEM market (2025) | $9.73B | SkyQuest / Mordor Intelligence |
| SIEM projected by 2030 | $19.13B | Mordor Intelligence |
| MDR market (2025) | $4.19B | Mordor Intelligence |
| MDR CAGR through 2030 | 21.95% | Mordor Intelligence |
| MSSP market (2025) | $39.47B | MarketsandMarkets |
| Application security market (2025) | $10.65B | Grand View Research / Mordor Intelligence |
| Solutions segment share | 61.73% | Fortune Business Insights |
| Cloud deployment share | 54.59% | Fortune Business Insights |
| Cloud deployment CAGR | 15.26% | Fortune Business Insights |
Nathan House's Analysis: Services Dominate — 60% of Spend Goes to Outsourcing
Add security services ($86.1B, Gartner) and MSSPs ($39.5B, MarketsandMarkets) together and you get $125.6 billion — roughly 60% of total cybersecurity spending goes to services, not products. That ratio tells a clear story: organizations cannot build internal security teams fast enough, so they buy expertise instead. Cross-referencing with the ISC2 data showing 4.8 million unfilled cybersecurity positions, this services dominance is a direct consequence of the skills gap. Companies that cannot hire a SOC analyst at $95K/year are paying managed services providers multiples of that cost. Until the workforce shortage closes — and it is widening, not narrowing — services will continue to command the majority of cybersecurity spend.
Explore Market Segments
The endpoint security market covers EDR, EPP, and XDR solutions. Device proliferation and remote work are primary growth drivers. CrowdStrike leads with Falcon, followed by Microsoft Defender and SentinelOne.
Nathan House's Analysis: MDR Is the Skills Gap Answer
MDR's 21.95% CAGR — nearly double the overall market rate — is not a coincidence. Cross-referencing with ISC2 data showing 4.8 million unfilled cybersecurity positions globally, MDR directly addresses the talent shortage by outsourcing detection and response to specialist providers. Organizations that cannot hire a SOC team can buy one through MDR. This segment will likely surpass $11.8B by 2029 (MarketsandMarkets), making it one of the few areas where market growth directly solves a structural industry problem.
Segment Growth Rankings
Not all segments are growing equally. Ranking by CAGR reveals where the cybersecurity market is shifting. MDR leads at 21.95%, followed by cloud-native application protection (CNAPP, ~15.3%), IAM (~14%), and SIEM (~14.5%). The legacy network security segment grows at a more moderate ~11%, as organizations shift from perimeter-based to identity-based security. Understanding these growth differentials is essential for career planning, vendor selection, and investment decisions.
The fastest-growing segments share a common thread: they address problems that traditional on-premises security cannot solve. MDR serves organizations without internal SOCs. CNAPP protects cloud-native applications that did not exist five years ago. IAM secures identities in a world where the network perimeter has dissolved. SIEM modernization handles the data volume explosion from cloud and hybrid environments. The slower-growing segments (network security, traditional MSSP) are mature markets being reshaped by cloud-native alternatives.
Market by Industry Vertical
Banking, Financial Services, and Insurance (BFSI) commands the largest share of cybersecurity spending at 21.54% of the total market (Fortune Business Insights). Financial institutions face the most stringent regulatory requirements (DORA, SOX, PCI-DSS) and the highest breach costs ($6.08M average per IBM). Government and defense follows, driven by national security mandates and critical infrastructure protection requirements.
Healthcare ($11.2M average breach cost — the highest of any industry per IBM) and manufacturing (33% of cyber insurance claims per Allianz) represent high-growth verticals. The convergence of IT and OT (operational technology) in manufacturing creates new attack surfaces that require specialized security solutions beyond traditional IT security. The SME segment across all verticals is growing at 15.47% CAGR, driven by ransomware targeting smaller organizations and downstream supply chain requirements from larger customers.
Education and public sector verticals typically spend below the industry average per employee but face significant threat volumes. Higher education in particular deals with open network architectures, BYOD policies, and research data protection requirements that create complex security challenges. The critical infrastructure sector (energy, water, transportation) is seeing accelerated spending post-Colonial Pipeline ($4.4M ransom, 2021) and increasing CISA mandates for ICS/SCADA security.
AI in Cybersecurity Market
The AI in cybersecurity market was worth $22.4 billion in 2023 (MarketsandMarkets) and is projected to reach $60.6 billion by 2028 and $133 billion by 2030 (Techopedia/VikingCloud). At a 21.9% CAGR, this is the fastest-growing segment in cybersecurity — nearly double the overall market growth rate of 13.8%. AI is simultaneously the biggest threat accelerant and the most effective defensive tool available.
| Finding | Value | Source |
|---|---|---|
| AI in cybersecurity market (2023) | $22.4B | MarketsandMarkets |
| Projected AI cybersecurity market (2028) | $60.6B | MarketsandMarkets |
| Projected AI cybersecurity market (2030) | $133B | Techopedia / VikingCloud |
| Cost savings from security AI/automation | $1.9M | IBM Cost of a Data Breach Report 2025 |
| Annual savings from AI/automation in security | $2.22M | IBM Cost of a Data Breach Report 2025 |
| Organizations using/planning AI security solutions | 97% | Fortinet 2025 Skills Gap Report |
Adoption is near-universal: 97% of organizations are using or planning to deploy AI-enabled cybersecurity solutions (Fortinet). IBM reports that organizations using security AI and automation save $1.9M to $2.22M annually on breach costs compared to those without. The ROI case for AI security is no longer theoretical — it is the clearest cost-saving measure available to security teams.
Nathan House's Analysis: AI Security Is the Fastest-Growing Segment
AI security's 21.9% CAGR is nearly double the overall cybersecurity market rate. Three data points explain why. First, IBM's Cost of a Data Breach report shows organizations using security AI save $1.9M to $2.22M per breach — a concrete, measurable ROI that justifies procurement. Second, 97% of organizations are already using or planning AI security tools (Fortinet), meaning this is not early-adopter territory — it is mainstream. Third, AI-powered threats (54% phishing click rates per HBR, deepfake-enabled social engineering) are creating an arms race where defenders must deploy AI to keep pace with AI-enabled attackers. The $22.4B to $133B trajectory from 2023 to 2030 reflects a market that is transitioning from optional enhancement to essential infrastructure.
💸 Venture Capital & Cybersecurity Investment
$14 billion in venture capital flowed into cybersecurity in 2025 across 392 funding rounds — a 47% increase from $9.5 billion in 2024 (SecurityWeek / Crunchbase). AI security startups led deal volume with 144 deals, while Series A and B rounds totaled $7.5 billion, up 63% year-over-year.
| Finding | Value | Source |
|---|---|---|
| Total VC funding (2024) | $9.5B | Crunchbase / Cybersecurity Ventures |
| Funding rounds (2024) | 304 | Crunchbase / Cybersecurity Ventures |
| Total VC funding (2025) | $14B | SecurityWeek |
| Funding rounds (2025) | 392 | Crunchbase |
| YoY growth in VC funding | 47% | SecurityWeek / Crunchbase |
| Series A & B investment (2025) | $7.5B | Crunchbase |
| Series A & B growth | 63% | Crunchbase |
| AI security deals (2025) | 144 | Crunchbase |
The largest funding rounds of 2025 show where investor confidence is concentrated: Saviynt ($700M in identity governance), Cyera ($540M in data security), Armis ($435M in asset intelligence), and Chainguard ($280M in software supply chain security). The theme across all four: protecting digital identity and data in cloud-native environments.
2025's Largest Cybersecurity Funding Rounds
| Company | Amount | Focus |
|---|---|---|
| Saviynt | $700M | Identity Governance |
| Cyera | $540M | Data Security |
| Armis | $435M | Asset Intelligence |
| Chainguard | $280M | Software Supply Chain |
| Vanta | $150M | Compliance Automation |
| 7AI | $130M | AI-Powered Security |
The 63% surge in Series A and B investment ($7.5B) is the clearest signal that VCs see long-term growth in cybersecurity startups. Early-stage funding means new companies entering the market — not just existing players raising growth rounds. AI security startups captured 144 deals (the most of any category), followed by risk and compliance (137 deals). This concentration reflects the two strongest demand drivers: AI as both threat and defense, and regulatory compliance as a permanent cost of doing business.
2024 VC Landscape
- $9.5B total funding
- 304 funding rounds
- 60% early stage (seed/Series A)
- Largest: Wiz $1B at $12B valuation
2025 VC Landscape
- $14B total funding (+47% YoY)
- 392 funding rounds (+29%)
- $7.5B in Series A & B (+63%)
- 144 AI security deals (most)
Nathan House's Analysis: VC Dollars as Market Signal
Every $1 billion of cybersecurity market value attracted $63.9M in VC funding in 2025. That ratio indicates VC confidence in the market's growth trajectory. The 63% surge in Series A and B funding is particularly telling — VCs are not just funding established players but betting heavily on the next generation of security companies. AI security's 144 deals (most of any category) signals where the market sees its next growth wave. The 2024-2025 funding surge reverses the contraction of 2022-2023 and suggests the cybersecurity startup ecosystem has regained momentum.
🏢 Key Vendors & Market Share
Five vendors dominate the cybersecurity market by revenue. Fortinet leads with $6.75B in annual revenue (FY2025), followed by Palo Alto Networks' $5.6B in next-gen security ARR (up 32% YoY) and CrowdStrike's $4.24B ARR (up 23%). Microsoft's security revenue exceeds $20B but is embedded within broader product suites, making direct comparison difficult.
| Finding | Value | Source |
|---|---|---|
| Palo Alto Networks NG ARR (FY2025) | $5.6B | Palo Alto Networks |
| Palo Alto NG ARR growth | 32% | Palo Alto Networks |
| CrowdStrike ARR (FY2025) | $4.24B | CrowdStrike |
| CrowdStrike ARR growth | 23% | CrowdStrike |
| Fortinet annual revenue (FY2025) | $6.75B | Fortinet |
Market concentration is moderate. The top five pure-play cybersecurity vendors control roughly 30% of the total addressable market (BeInsure). This fragmentation creates opportunities for specialised vendors — Zscaler dominates Zero Trust, CyberArk leads privileged access, and Wiz is disrupting cloud security. The market supports both platform consolidation (Palo Alto's "platformization" strategy) and best-of-breed specialisation.
Nathan House's Analysis: Platformization vs. Best-of-Breed
Palo Alto Networks reported 32% NG ARR growth — the strongest among pure-play vendors — driven by its platformization strategy of consolidating multiple security functions into a single platform. CrowdStrike's 23% ARR growth follows a similar trajectory with Falcon. Both are betting that enterprises want fewer vendors. Yet Wiz raised $1B and Saviynt raised $700M in single rounds, suggesting VCs still see room for specialists. The resolution is not either/or: platforms will dominate for mid-market, while large enterprises and regulated industries will continue buying best-of-breed for critical functions.
Vendor Competitive Landscape
The cybersecurity vendor landscape is consolidating at the top while fragmenting at the edges. Three platform plays dominate enterprise sales: Palo Alto Networks (network + cloud + endpoint), CrowdStrike (endpoint + identity + cloud), and Microsoft (integrated across M365, Azure, and Defender). Each reported 20%+ ARR growth, suggesting the platform thesis is working for enterprise buyers who want fewer vendor relationships and integrated telemetry.
Below the platform tier, specialist vendors thrive in high-growth niches. Zscaler leads Zero Trust network access (~$2.3B revenue). CyberArk dominates privileged access management. Wiz disrupted the cloud security market so effectively that it attracted a $12B valuation in just four years. The market is not winner-take-all — it rewards both consolidators and innovators, depending on the buyer's maturity and risk profile.
Microsoft is the wild card. Its security business exceeds $20 billion annually, but it is bundled with broader licensing (E5 suites). This creates a pricing advantage that concerns pure-play vendors — when security is included "free" in existing contracts, it changes procurement dynamics. Check Point (~$2.6B revenue) and Trend Micro maintain significant market positions in specific segments (firewall, endpoint) but face pressure from both platform consolidators above and specialists below.
Nathan House's Analysis: The Microsoft Factor
Microsoft's security revenue exceeds $20B — more than Palo Alto, CrowdStrike, and Fortinet combined. But the comparison is misleading because Microsoft bundles security into M365 and Azure licensing. The practical impact: organizations already paying for E5 licenses get Defender, Sentinel, and Entra ID at marginal cost. This forces pure-play vendors to compete on detection quality, not price. CrowdStrike's 23% ARR growth despite this pressure suggests the pure-play value proposition holds — for now. The risk is that Microsoft's quality improves faster than specialists can differentiate.
🚀 Cybersecurity Market Growth Drivers
Eight structural forces are pushing the cybersecurity market toward $700 billion by 2034. These are not cyclical trends — they are permanent shifts in how organizations operate, defend, and comply. Understanding each driver is critical for forecasting where the market is headed.
📜 Regulatory Compliance
NIS2 (EU), DORA (financial sector), SEC disclosure rules (US), and GDPR enforcement are forcing organizations to invest or face penalties. The EU NIS2 directive alone expands cybersecurity requirements to 160,000+ entities.
🤖 AI-Powered Threats
AI phishing achieves 54% click rates (HBR). GenAI lowers the barrier for threat actors, creating a permanent escalation dynamic. 66% of organizations expect AI to have the most significant cybersecurity impact (WEF 2025).
☁️ Cloud Migration
Cloud deployment captures 54.59% of the cybersecurity market and is growing at 15.26% CAGR. Multi-cloud and hybrid environments create new attack surfaces that require specialized security tooling.
💼 Remote & Hybrid Work
The permanent shift to distributed workforces has expanded the attack perimeter. Zero Trust adoption (41% of organizations) and SASE deployments are direct responses to dissolving network boundaries.
💣 Ransomware Growth
Ransomware-as-a-Service has lowered the barrier to entry, increasing attack frequency. Present in 44% of all breaches (Verizon DBIR 2025). Organizations must invest in prevention, detection, and recovery.
🛡️ Cyber Insurance Requirements
Insurers increasingly mandate MFA (~80%), EDR (65%), and security controls as prerequisites for coverage. The $16.6B cyber insurance market creates indirect demand for security products.
🔒 Zero Trust Adoption
41% of organizations have adopted Zero Trust frameworks (IBM/VikingCloud). Government mandates (US Executive Order 14028) are accelerating adoption, driving demand for IAM, microsegmentation, and continuous verification.
🌏 Digital Transformation
Emerging markets (India, Brazil, Middle East) are undergoing rapid digitization. The SME cybersecurity segment is growing at 15.47% CAGR as small businesses face increasing attack volumes and regulatory pressure.
Nathan House's Analysis: The Regulation-Spending Feedback Loop
A clear pattern emerges from cross-referencing Gartner spending data with regulatory timelines. Security spending growth accelerated from ~10% in 2022 to 15% in 2026, tracking almost exactly with the enforcement timelines of NIS2 (Oct 2024), DORA (Jan 2025), and SEC cybersecurity disclosure rules (Dec 2023). Regulation does not just drive compliance spending — it changes board-level risk calculus. When non-compliance means personal liability for executives (NIS2's management accountability provisions), cybersecurity budgets move from discretionary to mandatory.
Key Regulatory Drivers by Region
| Regulation | Region | Effective | Market Impact |
|---|---|---|---|
| NIS2 Directive | EU (27 states) | Oct 2024 | 160,000+ entities across 18 sectors; management accountability |
| DORA | EU (financial sector) | Jan 2025 | ICT risk management for banks, insurers, fintechs |
| SEC Disclosure Rules | US | Dec 2023 | Material breach reporting within 4 days; board oversight required |
| CMMC 2.0 | US (defense) | 2025-2026 | 300,000+ defense contractors must certify cybersecurity maturity |
| DPDP Act | India | 2024-2025 | Data protection for 1.4B population; fines up to INR 250 crore |
| LGPD | Brazil | 2020 (maturing) | GDPR-equivalent for Latin America's largest economy |
The regulatory landscape is converging globally. What started with GDPR in 2018 has now spread to every major economy. The pattern is consistent: mandatory breach notification, board-level accountability, and financial penalties that make non-compliance more expensive than compliance. Each new regulation creates a step-function increase in security spending for the affected organizations, and the cumulative effect is visible in Gartner's 15% YoY spending growth.
The cyber insurance market ($16.6B, Swiss Re) amplifies this regulatory pressure. Insurers increasingly mandate security controls — approximately 80% require MFA, 65% expect EDR, and 41% deny applications that fail to meet minimum standards (Marsh). For organizations seeking coverage, the insurer's security requirements often exceed regulatory minimums, creating an additional spending catalyst that operates independently of government mandates.
🔮 Cybersecurity Market Predictions & Forecasts
Multiple authoritative sources project the cybersecurity market to at least double by 2030 and potentially quadruple by 2034. The forecasts diverge by scope and methodology, but they converge on one point: double-digit annual growth is the baseline, not the optimistic scenario.
| Source | 2030 Forecast | 2034 Forecast | CAGR |
|---|---|---|---|
| Fortune Business Insights | — | $699.39B | 13.8% |
| Precedence Research | — | $878.48B | 12.6% |
| Grand View Research | $500.70B | — | 12.9% |
| MarketsandMarkets | $351.92B | — | 9.1% |
| IDC | — | — | 12.2% |
Cybersecurity Investment Benchmark Calculator
See how your organization's security spend compares to industry benchmarks.
Nathan House's Analysis: Where the Smart Money Goes
Cross-referencing VC funding data with market segment growth rates reveals a clear pattern: investors are betting on segments with 15%+ CAGR. Cloud security ($1B Wiz round), identity governance ($700M Saviynt), and data security ($540M Cyera) all target markets growing faster than the overall 13.8% average. The $14B in 2025 VC funding represents a market confidence signal — investors do not pour 47% more capital into a market they expect to plateau. For organizations planning 3-5 year security roadmaps, following the VC money often previews which technologies will become mainstream.
What the Forecasts Agree On
Despite the wide range of specific projections ($351.92B to $878.48B by 2030-2034), every major research firm agrees on four directional conclusions. First, double-digit annual growth is the baseline — no credible source projects single-digit CAGR for the cybersecurity market through 2030. Second, cloud security and identity management are the fastest-growing product segments. Third, Asia-Pacific will gain market share at the expense of North America's dominance. Fourth, managed services (MSSP, MDR) will grow faster than in-house security products as the skills gap persists.
The areas of disagreement are scope and timeline. Conservative estimates (MarketsandMarkets, BCC Research) focus narrowly on security products and reach $350-400B by 2030. Aggressive estimates (Grand View, Precedence) include managed services, consulting, and adjacent categories, reaching $500-878B. Both are valid — they just measure different things. When citing cybersecurity market size, always specify which scope definition the source uses.
Where Forecasts Converge
- Double-digit CAGR through 2030+
- Cloud & IAM as fastest-growing segments
- APAC gaining market share
- Managed services outpacing products
- Regulation as permanent demand driver
Where Forecasts Diverge
- 2030 range: $351B to $501B
- Scope: products only vs full ecosystem
- AI impact: accelerator vs uncertainty
- China market trajectory
- SME vs enterprise growth split
For security leaders and investors, the practical takeaway is clear. Even the most conservative projection (MarketsandMarkets, $351.92B by 2030) implies 61% growth from today's $218.98B. The most aggressive (Precedence, $878.48B by 2034) implies a 4x increase. In either scenario, cybersecurity is one of the fastest-growing technology sectors globally, and organizations that under-invest face both security and competitive risk.
Nathan House's Analysis: The $500B Question
Will the cybersecurity market hit $500 billion by 2030? Grand View Research says yes at 12.9% CAGR. MarketsandMarkets says no with a more conservative 9.1%. After cross-referencing both with Gartner's spending data (which shows 15% YoY growth in ${currentYear}, not 9%), I believe the higher end is more likely. Three forces that did not exist five years ago — mandatory breach disclosure (SEC, NIS2), AI-powered attacks (54% phishing click rates), and cloud-native threats (CNAPP growing at 15%+ CAGR) — are structural accelerants. The $500B question will be answered by regulation, not market sentiment.
🎯 Key Takeaways
- The cybersecurity market is a $219 billion industry in 2026 and is on track to reach $699B by 2034 at 13.8% CAGR (Fortune Business Insights).
- The US dominates with $87.42B (39.9% of global), spending $257 per capita on cybersecurity — more than any other nation.
- North America holds 43% market share, but Asia-Pacific is the growth story — India (16% CAGR) and Australia (18.4%) are the fastest-growing major markets.
- Gartner projects $240B in security spending by 2026, with AI and cloud remaining the primary catalysts.
- MDR is the fastest-growing segment at 21.95% CAGR, directly addressing the 4.8M cybersecurity workforce gap.
- VC funding hit $14B in 2025 (+47% YoY), with AI security startups leading deal volume at 144 deals.
- Cloud deployment now captures 54.59% of the cybersecurity market, growing at 15.26% CAGR.
- Regulation is the strongest demand driver — NIS2, DORA, and SEC rules are making security spending mandatory, not discretionary.
What This Means For You
For Security Leaders
Use the $2,700 per-employee benchmark (Deloitte) to size your budget. If you are below that figure, cross-reference with your industry vertical — BFSI and healthcare should be higher. Build your business case around the 99% PwC statistic: your peers are all increasing spend. Use the regulation timeline table to anticipate compliance-driven budget needs 12-18 months ahead.
For Career Changers
A market growing at 13.8% CAGR means persistent talent demand. The 4.8M unfilled positions (ISC2) are not shrinking. Focus on the fastest-growing segments: cloud security, MDR, and identity management. The country data shows strong markets in the US, UK, Germany, Japan, India, and Australia. Consider emerging markets (UAE, Singapore) where growth rates exceed 14%.
For Investors
Follow the VC money: $14B in 2025 VC funding went disproportionately to identity governance (Saviynt $700M), data security (Cyera $540M), and AI security (144 deals). Platform vendors (Palo Alto 32% NG ARR growth, CrowdStrike 23%) are consolidating mid-market, while specialists thrive in high-growth niches. The 47% YoY VC increase signals strong investor confidence in the sector.
For Business Leaders
Security is no longer an IT cost center — it is a compliance and business continuity requirement. NIS2 introduces personal liability for senior management. SEC rules mandate 4-day breach disclosure. Cyber insurers deny 41% of applications that fail security requirements (Marsh). Under-investment in cybersecurity creates legal, financial, and operational risk that directly impacts the business.
❓ Frequently Asked Questions
How big is the cybersecurity market in 2026? ▼
The global cybersecurity market is valued at $218.98 billion in 2026 (Fortune Business Insights). Gartner separately forecasts $213 billion in end-user security spending for the same year. The difference reflects scope — Fortune BI includes the full security ecosystem while Gartner focuses on end-user spending.
What is the cybersecurity market CAGR? ▼
The cybersecurity market CAGR ranges from 9.1% (MarketsandMarkets, 2025-2030) to 13.8% (Fortune Business Insights, 2026-2034). Precedence Research projects 12.6% CAGR through 2034. The variance depends on scope and forecast horizon. All sources agree on sustained double-digit annual growth.
Which country has the largest cybersecurity market? ▼
The United States has the largest cybersecurity market at $87.42 billion (Precedence Research, 2026), representing approximately 39.9% of the global market. China is second at $13.03 billion, followed by the UK ($11.55B), Germany ($11.36B), and Japan ($11.13B).
How much will the cybersecurity market be worth by 2030? ▼
Forecasts for 2030 range from $351.92 billion (MarketsandMarkets, 9.1% CAGR) to $500.70 billion (Grand View Research, 12.9% CAGR). The midpoint of approximately $425 billion is a reasonable working estimate. The variance reflects different scope definitions across research firms.
What is the fastest-growing cybersecurity market segment? ▼
Managed Detection and Response (MDR) is the fastest-growing segment at 21.95% CAGR (Mordor Intelligence), projected to grow from $4.19 billion in 2026 to $11.8 billion by 2029. Cloud deployment (15.26% CAGR) and the SME segment (15.47% CAGR) are also growing well above the market average.
How much do companies spend on cybersecurity per employee? ▼
The average cybersecurity spend per employee is $2,700 annually (Deloitte). Security typically consumes about 12% of the total IT budget (VikingCloud). These figures vary significantly by industry — financial services and healthcare spend considerably more, while retail and education typically spend less per employee. Use the benchmark calculator above to compare your organization.
How much VC funding goes into cybersecurity? ▼
Cybersecurity companies raised $14 billion in venture capital across 392 funding rounds in 2025, a 47% increase from $9.5 billion in 2024 (SecurityWeek/Crunchbase). AI security startups led deal volume with 144 deals. The largest rounds went to Saviynt ($700M), Cyera ($540M), and Armis ($435M).
What drives cybersecurity market growth? ▼
Eight structural forces drive the cybersecurity market: regulatory compliance (NIS2, DORA, SEC disclosure rules), AI-powered threats, cloud migration, remote/hybrid work, ransomware growth, cyber insurance requirements, Zero Trust adoption, and digital transformation in emerging markets. Regulation is the strongest single driver — when non-compliance means personal liability for executives, cybersecurity spending moves from discretionary to mandatory.
About This Data
This article draws from 79 statistics aggregated from 50+ authoritative sources including IBM Cost of a Data Breach, Verizon DBIR, CrowdStrike Global Threat Report, WEF Global Cybersecurity Outlook, FBI IC3, ISC2 Cybersecurity Workforce Study, Sophos, Gartner, Mandiant M-Trends, and Ponemon Institute reports.
Derived statistics (marked "Nathan House's Analysis") are computed by cross-referencing data from multiple sources — for example, comparing breach costs across industries using IBM data, or validating ransomware trends across Verizon, Sophos, and HIPAA Journal findings.
All statistics include inline source citations with links to primary sources. Data spans 2023-2026, with preference given to the most recent available figures. Last updated: June 2026.
How to Use This Data
Security professionals can use these statistics to build business cases for cybersecurity investment, benchmark spending against industry averages, and justify budget requests with hard data. Compare your organization's spend-per-employee ($2,700 industry average per Deloitte) against the benchmark calculator above. Use the country and regional data to localise your business case.
When citing market size figures, specify which research firm and methodology you are referencing. Fortune Business Insights and Precedence Research include the broadest scope (products, services, consulting), while MarketsandMarkets focuses on core security products. Gartner's spending figures reflect end-user expenditure, not total market value. These are complementary views of the same market — not contradictions.
For board-level presentations, the most effective data points are: the $218.98B global market size (establishes scale), the 13.8% CAGR (demonstrates trajectory), the $2,700 per-employee benchmark (enables internal comparison), and the 99% budget increase statistic (shows competitive pressure). For regulatory compliance arguments, use the NIS2, DORA, and SEC disclosure timelines.
This page is updated monthly as new reports are published. Bookmark it and return for the latest data. If you spot an outdated statistic or want to suggest a source, contact us.
Data Sources
This article aggregates data from the following primary sources. Where multiple sources report on the same metric, we cross-reference and note the variance. All statistics include inline citations linking to the original report.
Market Research Firms
- Fortune Business Insights (2025-2034 forecasts)
- Precedence Research (2025-2034 forecasts)
- MarketsandMarkets (2025-2030 forecasts)
- Grand View Research (2025-2030 forecasts)
- Mordor Intelligence (country/segment data)
- Statista (country revenue projections)
- IMARC Group (country-level analysis)
Industry Analysts & Reports
- Gartner (security spending forecasts)
- IDC (spending growth projections)
- SecurityWeek (VC funding analysis)
- Crunchbase (startup investment data)
- PwC Digital Trust Insights 2025
- Deloitte (per-employee benchmarks)
- IBM Cost of a Data Breach 2025
About the Author

Nathan House, Founder & CEO of StationX
Nathan House has 30 years of hands-on cybersecurity experience and is Cambridge-educated, holding CISSP, CISA, CISM, OSCP, CEH, and SABSA. He founded StationX in 1999 — one of the UK’s first cybersecurity companies — and has secured £71 billion in UK mobile banking transactions and the London 2012 Olympics, advising clients including Microsoft, Cisco, BP, Vodafone, and VISA. He authored the world’s most popular cybersecurity course — a #1 Udemy bestseller taken by over 500,000 students — and was named Cyber Security Educator of the Year 2020, AI Security Educator of the Year, and a UK Top 25 Security Influencer 2025. A DEF CON speaker and featured expert on CNN, Fox News, NBC, and the BBC, Nathan leads StationX’s training of more than half a million students worldwide.