Identity Theft Statistics [2026]: 50+ Facts & Trends

$47 billion. That's what identity fraud and scams cost Americans in 2024 alone, affecting 40 million victims (Javelin). The FTC logged over 1.1 million identity theft reports the same year — a 9.5% increase — with credit card fraud topping every other category. If you need identity theft statistics to quantify the threat, support a budget request, or build security awareness training, this is your source.
You'll find 64+ identity theft facts and identity fraud statistics across 12 sections below — from FTC complaint trends and credit card fraud statistics to synthetic identity fraud and state-level breakdowns — sourced from the FTC, Javelin, TransUnion, FBI IC3, SpyCloud, and more. Each section includes original cross-referenced analysis you won't find in any single report.
Key Identity Theft Statistics at a Glance
- $47 billion — total US identity fraud and scam losses in 2024 (Javelin)
- 1,135,270 — FTC identity theft reports filed in 2024, up 9.5% YoY
- 40 million — Americans affected by identity fraud or scams (Javelin)
- 449,032 — credit card fraud reports, the most common identity theft type
- $16 billion — account takeover fraud losses, 59% of all identity fraud losses
- $3.3 billion — synthetic identity fraud lender exposure, an all-time high (TransUnion)
- 54% — Millennials who have been identity theft victims (highest generation)
- $4.8 billion — fraud losses for victims aged 60+, highest dollar loss by age (FBI IC3)
Last updated: June 2026
📊 Key Identity Theft Numbers (2026)
Identity theft remains one of the fastest-growing crimes in the US. The FTC received 1,135,270 identity theft reports in 2024 — up 9.5% from 1,036,845 in 2023. Identity theft accounted for 18% of all 6.5 million Consumer Sentinel Network reports, making it the second-largest complaint category after credit bureau disputes.
| Finding | Value | Source |
|---|---|---|
| Total identity fraud & scam losses (US, 2024) | $47B | Javelin Strategy & Research 2025 Identity Fraud Study |
| Identity theft reports filed with FTC (2024) | 1,135,270 | FTC Consumer Sentinel Network 2024 |
| Identity fraud & scam victims (2024) | 40 million | Javelin Strategy & Research 2025 Identity Fraud Study |
| Synthetic identity fraud exposure (all-time high) | $3.3B | TransUnion |
| Total reported fraud losses (FTC, 2024) | $12.5B | FTC Consumer Sentinel Network 2024 |
| Projected global account takeover losses | $17B | SEON |
| Credit card fraud reports (2024) | 449,032 | FTC Consumer Sentinel Network 2024 |
| Account takeover fraud losses (2024) | $16B | Javelin Strategy & Research 2025 Identity Fraud Study |
Nathan House's Analysis: The Real Cost Per Victim
Dividing Javelin's $47B total across 40 million victims gives an average cost of $1175 per victim. But the picture changes when you separate identity fraud ($27B across 18 million victims = $1500 per victim) from scams ($20B across 22 million). Identity fraud victims lose significantly more per incident because criminals have longer access to compromised accounts.
📈 Identity Theft Reports & Trends
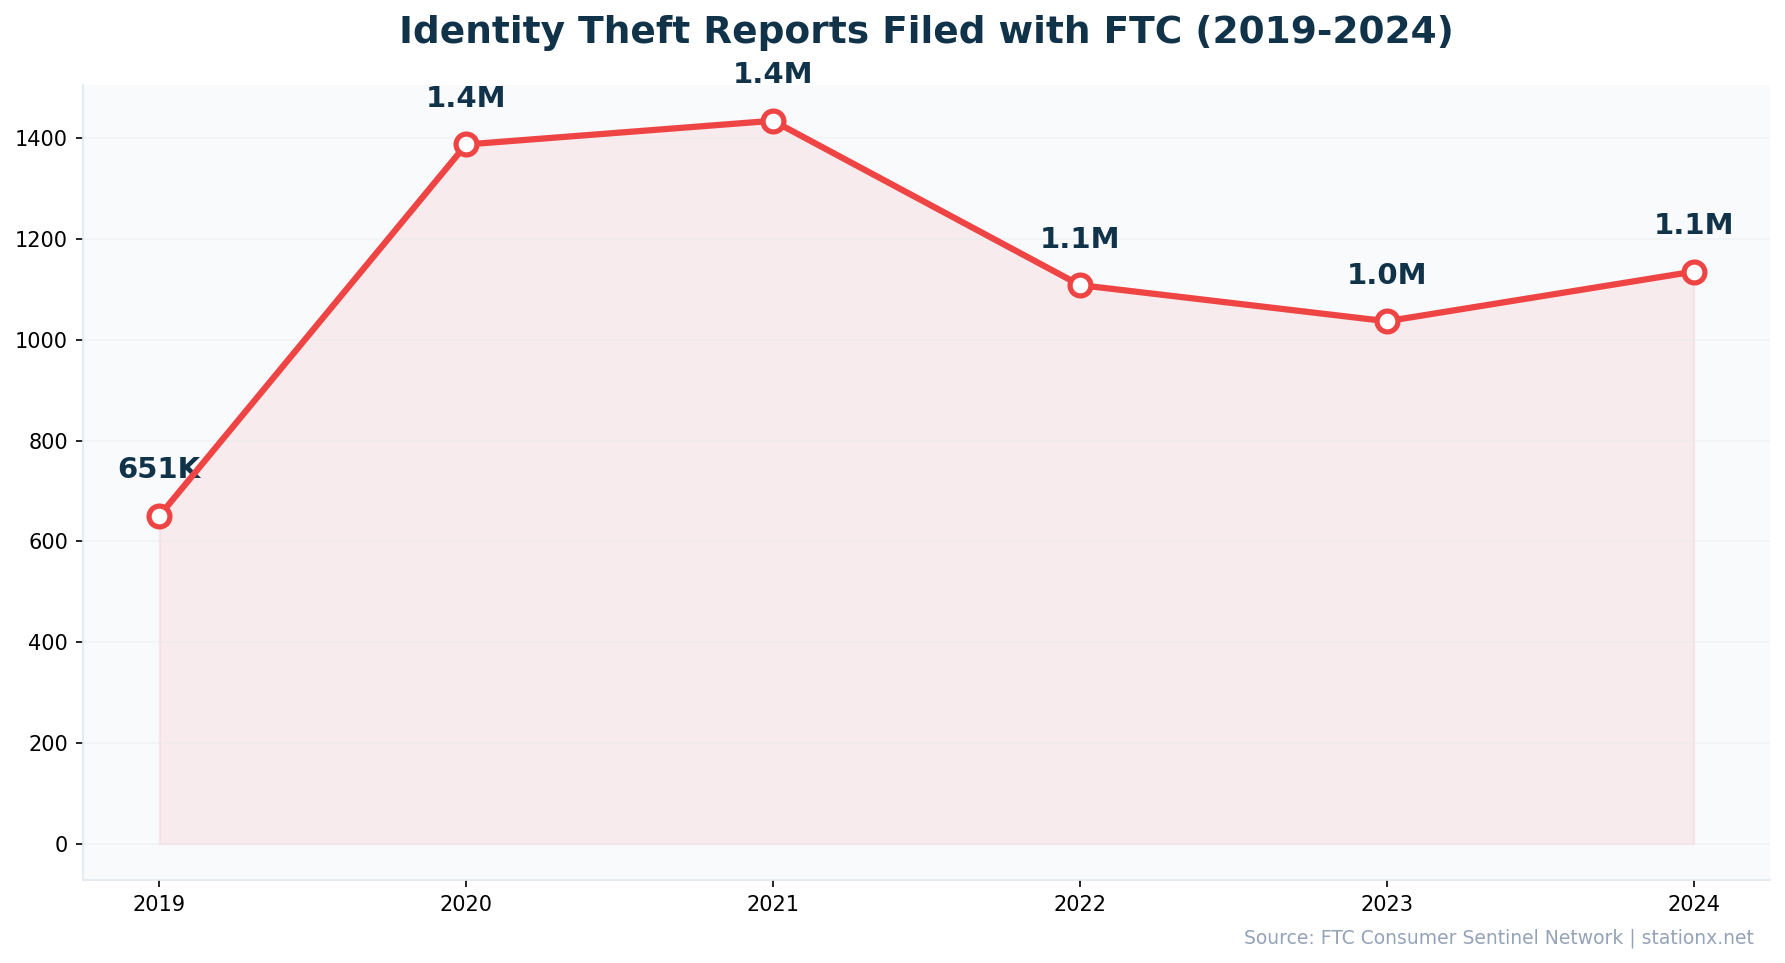
FTC identity theft reports surged 113% between 2019 (650,572) and 2021 (1,434,676) — driven by pandemic-era unemployment fraud and stimulus payment scams. Reports declined through 2023 as those programmes ended, but reversed course in 2024 with a 9.5% increase to 1,135,270 reports.
Credit card fraud drove the 2024 rebound. The FTC received 449,032 credit card fraud reports — an 8% increase from 416,000 in 2023. The “other identity theft” category surged 38% to 359,008, suggesting new fraud vectors that don't fit traditional categories.
| Finding | Value | Source |
|---|---|---|
| FTC identity theft reports (2024) | 1,135,270 | FTC Consumer Sentinel Network 2024 |
| FTC identity theft reports (2023) | 1.1 million | FTC Consumer Sentinel Network |
| Identity theft share of all Sentinel reports | 18% | FTC Consumer Sentinel Network 2024 |
| Total Consumer Sentinel reports (2024) | 6.5 million | FTC Consumer Sentinel Network 2024 |
| Credit card fraud reports (top category) | 449,032 | FTC Consumer Sentinel Network 2024 |
Nathan House's Analysis: The Pandemic Spike Was Real, But the Trend Is Rising Again
The 2021 peak (1.43 million reports) was largely pandemic-driven unemployment fraud. Reports fell 29% over the next two years as those programmes closed. But the 2024 uptick (9.5% increase) signals a structural shift: synthetic identity fraud, AI-powered phishing, and account takeover are replacing the opportunistic pandemic fraud with more sophisticated, harder-to-detect schemes.
📋 Types of Identity Theft
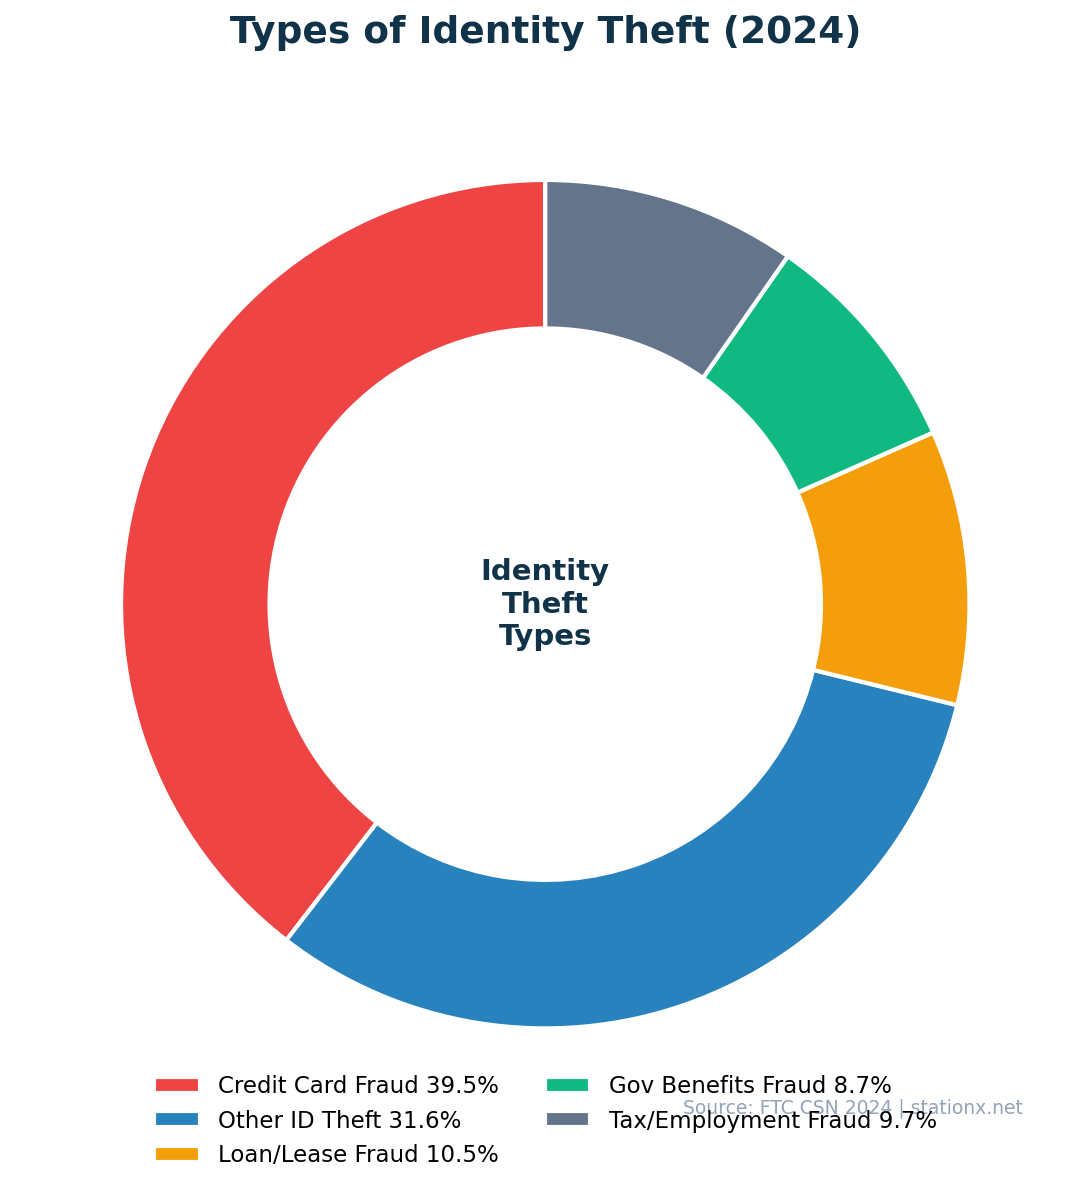
Credit card fraud dominates identity theft with 449,032 reports in 2024 — 39.6% of all identity theft complaints. In 90% of credit card identity theft cases, criminals open new accounts rather than hijacking existing ones (FTC/Motley Fool). Global credit and debit card fraud losses are projected to reach $48 billion in 2025 (Nilson Report).
Identity Theft Type Explorer
Select a type to see detailed statistics and insights.
Credit card fraud is the most common type of identity theft. In 90% of cases, criminals open new cards rather than hijacking existing ones.
Account takeover accounts for 59% of all identity fraud losses. Attackers use stolen credentials, session cookies, and credential stuffing to hijack accounts.
Synthetic identity fraud combines real and fabricated information to create new identities. AI has accelerated this threat by 311% in just one year.
Tax identity theft occurs when criminals use stolen SSNs to file fraudulent returns or gain employment, leaving victims to untangle IRS complications.
Medical identity theft costs the US healthcare system $41.3B annually. It can corrupt health records and lead to misdiagnosis or wrong treatments.
| Finding | Value | Source |
|---|---|---|
| Credit card fraud (most common type) | 449,032 | FTC Consumer Sentinel Network 2024 |
| Account takeover fraud losses | $16B | Javelin Strategy & Research 2025 Identity Fraud Study |
| Credit card ID theft involving new cards | 90% | FTC / Motley Fool |
| Synthetic identity fraud exposure | $3.3B | TransUnion |
| Scam victims who also lost PII | 70% | Javelin Strategy & Research 2025 Identity Fraud Study |
| Projected global card fraud losses (2025) | $48B | Nilson Report |
Highest-Loss Types
- Account takeover: $16B losses
- Synthetic identity: $3.3B exposure
- Medical ID theft: $41.3B healthcare costs
Highest-Volume Types
- Credit card fraud: 449,032 reports
- Other identity theft: 359,008 reports
- Loan/lease fraud: 118,737 reports
Nathan House's Analysis: Volume vs Losses Tell Different Stories
Credit card fraud leads in report volume (39.6% of complaints) but account takeover leads in dollar losses ($16B, 59% of identity fraud losses). This gap matters: credit card fraud is easier to detect and resolve, while account takeover drains bank accounts, investment portfolios, and retirement funds where losses are harder to recover. The FTC numbers measure what people report; the Javelin numbers measure what it costs them.
💰 Identity Theft Losses
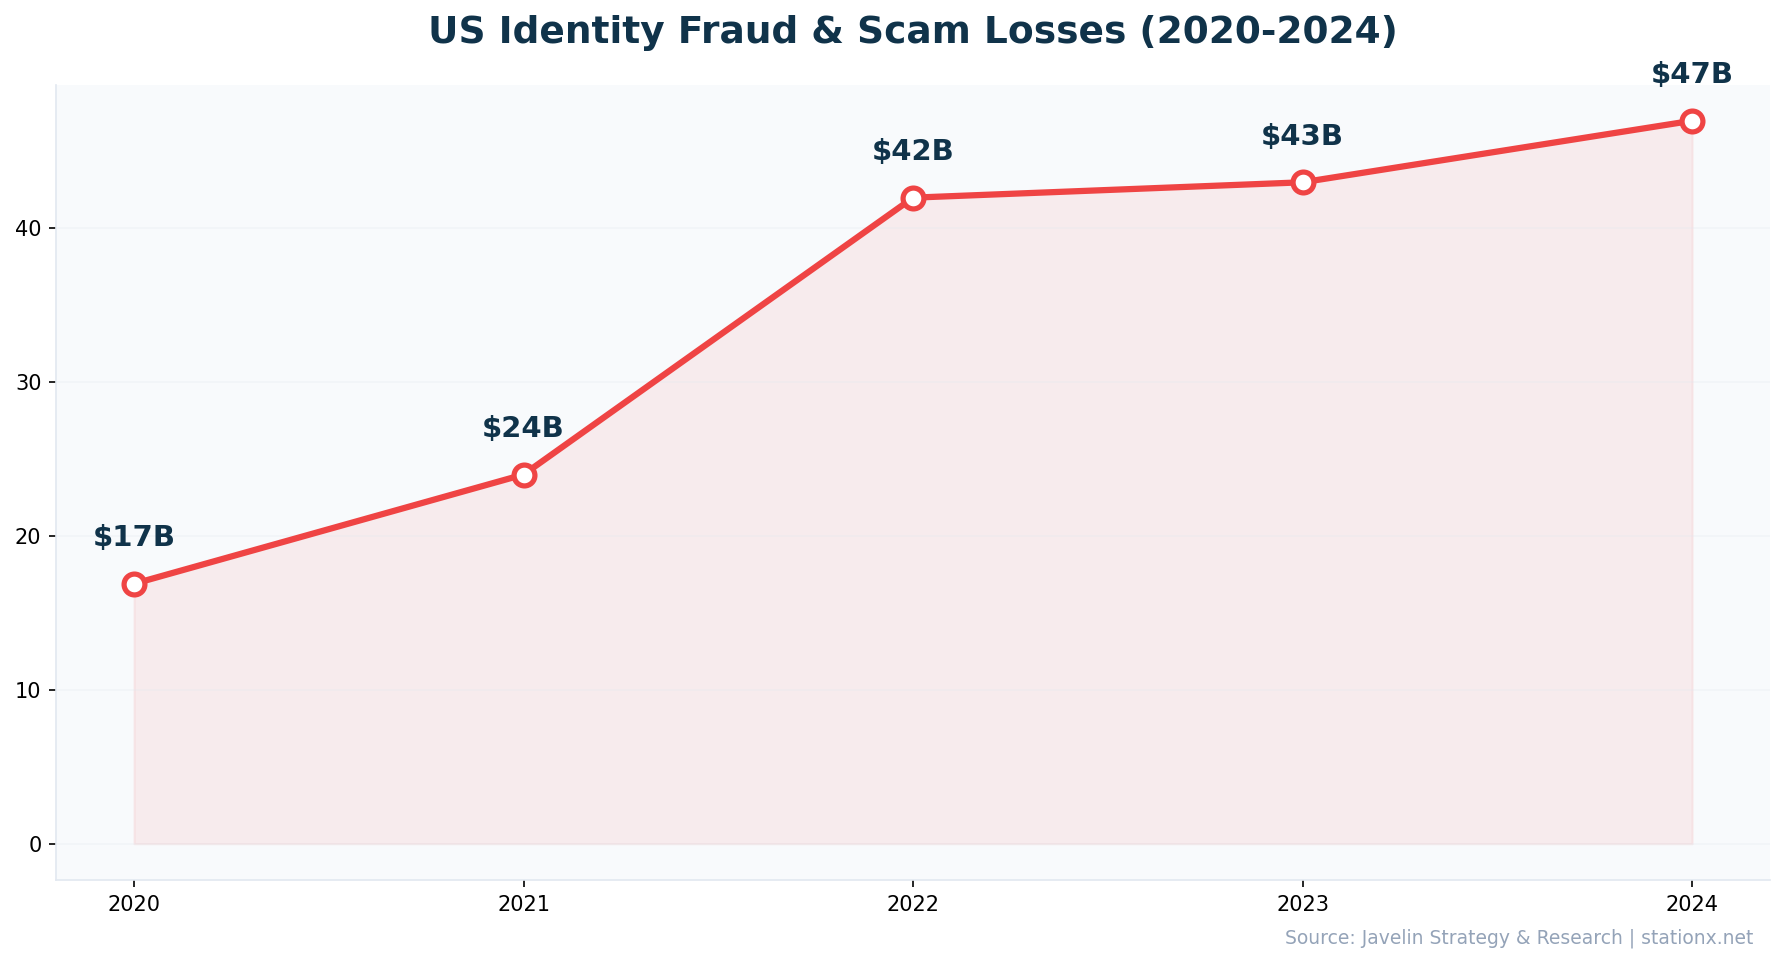
Identity fraud and scam losses reached $47 billion in 2024, up $4 billion from the prior year (Javelin). This total splits into two categories: identity fraud ($27 billion across 18 million victims) and scams ($20 billion across 22 million victims). Account takeover accounts for $16 billion of the identity fraud losses — 59% of the total.
Separately, the FTC reported $12.5 billion in total fraud losses in 2024 — a 25% increase over 2023. Investment scams led FTC categories at $5.7 billion. The FTC and Javelin numbers differ because the FTC tracks what consumers report through official channels, while Javelin's study surveys a broader population including unreported losses.
| Finding | Value | Source |
|---|---|---|
| Total identity fraud & scam losses (2024) | $47B | Javelin Strategy & Research 2025 Identity Fraud Study |
| Identity fraud losses (excluding scams) | $27B | Javelin Strategy & Research 2025 Identity Fraud Study |
| Scam-related losses | $20B | Javelin Strategy & Research 2025 Identity Fraud Study |
| Account takeover fraud losses | $16B | Javelin Strategy & Research 2025 Identity Fraud Study |
| FTC total reported fraud losses | $12.5B | FTC Consumer Sentinel Network 2024 |
| Losses for victims aged 60+ (FBI IC3) | $4.8B | FBI Internet Crime Report 2024 |
| Projected global ATO losses | $17B | SEON |
The Hidden Cost: PII Theft Compounds Future Losses
70% of scam victims also had their PII stolen (Javelin). This means a single scam doesn't just cost the initial loss — it seeds future identity fraud. Email addresses (43%), phone numbers (38%), and banking details (28%) were the top pieces of information stolen, each serving as a key to further account compromises.
Nathan House's Analysis: The $47B Figure Understates Reality
Javelin's $47B covers direct fraud and scam losses. It does not include the estimated 200+ hours victims spend on recovery (ITRC), lost wages during that time, credit damage, emotional distress, or the downstream cost of stolen PII being resold. The FTC's $12.5B figure is even lower because it only captures officially reported losses. The true economic impact of identity theft is likely several times the $47B headline figure.
👤 Identity Theft Age Demographics
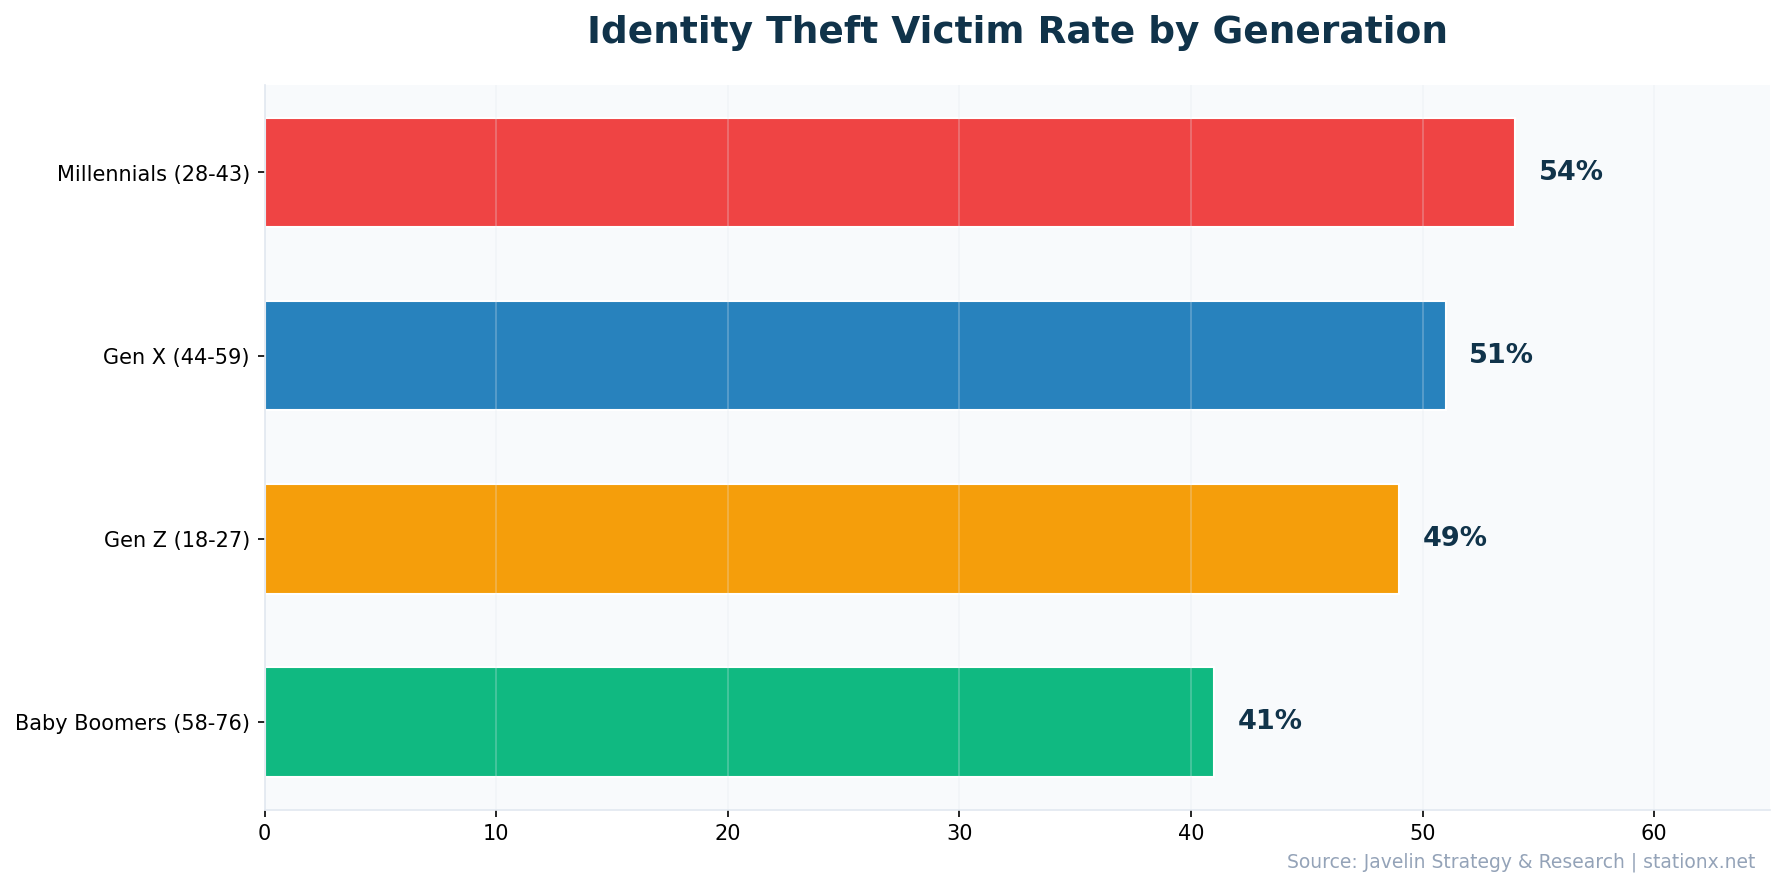
Millennials (ages 28-43) report the highest identity theft victim rate at 54%, followed by Gen X at 51%, Gen Z at 49%, and Baby Boomers at 41% (Javelin). Adults aged 30-39 have reported the most identity theft incidents for four consecutive years. The FTC data consistently shows this age group files the most reports.
| Finding | Value | Source |
|---|---|---|
| Millennials victim rate (highest) | 54% | Javelin Strategy & Research 2025 Identity Fraud Study |
| Gen X victim rate | 51% | Javelin Strategy & Research 2025 Identity Fraud Study |
| Gen Z victim rate | 49% | Javelin Strategy & Research 2025 Identity Fraud Study |
| Baby Boomers victim rate (lowest) | 41% | Javelin Strategy & Research 2025 Identity Fraud Study |
| Losses for victims aged 60+ | $4.8B | FBI Internet Crime Report 2024 |
| Children vs adults likelihood | 51x | Javelin / Carnegie Mellon CyLab |
Most Reports
- 30-39 age group: most reports filed
- Millennials: 54% victim rate
- Higher digital footprint = more exposure
Highest Losses
- Over 60: $4.8B in total losses (FBI IC3)
- Boomers: higher loss per incident
- Bank account fraud: biggest category for seniors
Nathan House's Analysis: Who Reports vs Who Loses More
There's a critical gap between reporting rates and financial losses. Millennials report the most identity theft (54% victim rate), but adults over 60 suffer the highest total losses ($4.8B per FBI IC3). Boomers report less frequently (41%) but lose more per incident. This likely reflects both the higher average savings of older adults and the fact that bank account fraud — which targets larger balances — disproportionately affects seniors. Younger victims lose less per incident but recover faster.
Children: A Hidden Vulnerability
Children are 51x more likely to be identity theft victims than adults (Javelin/Carnegie Mellon CyLab). An estimated 10% of American children's Social Security numbers have been used by someone else. Child identity theft often goes undetected for years — until the child applies for their first credit card or student loan and discovers a ruined credit history. In 60% of cases, the perpetrator is someone the child knows.
🗺️ Identity Theft by State
Florida leads the US in identity theft with 528 reports per 100,000 residents — holding the top position for the fourth consecutive year. Georgia follows closely at 517 per 100,000, then Nevada (466), Texas (393), and Delaware (392). These five states account for a disproportionate share of total identity theft reports.
State Identity Theft Explorer
Select a state to see its identity theft data and trends.
Trend: Highest per capita for 4 consecutive years
Top type: Credit card fraud
Trend: Consistently in top 3 since 2020
Top type: Credit card fraud
Trend: Rising rapidly since 2022
Top type: Credit card fraud
Trend: Highest total reports after Florida
Top type: Credit card fraud
Trend: Small state, high per-capita rate
Top type: Credit card fraud
| Finding | Value | Source |
|---|---|---|
| Florida (highest rate per 100K) | 528 | FTC Consumer Sentinel / LendingTree |
| Georgia (2nd highest) | 517 | FTC Consumer Sentinel / LendingTree |
| Nevada (3rd highest) | 466 | FTC Consumer Sentinel / LendingTree |
| Texas (4th highest) | 393 | FTC Consumer Sentinel / LendingTree |
| Delaware (5th highest) | 392 | FTC Consumer Sentinel / LendingTree |
Nathan House's Analysis: Why Florida Leads Year After Year
Florida's persistent #1 ranking isn't random. The state has the second-largest elderly population in the US (a high-value target for fraud), a major port of entry for international crime networks, and high population density in fraud-prone metros like Miami-Dade and Tampa Bay. Georgia's #2 position likely reflects Atlanta's role as a financial services hub with extensive credit card processing infrastructure. These structural factors mean state rankings tend to be persistent, not cyclical.
🤖 Synthetic Identity Fraud
Synthetic identity fraud — where criminals combine real and fabricated information to create entirely new identities — is the fastest-growing type of financial crime. US lender exposure hit $3.3 billion in 2024, an all-time high (TransUnion). Synthetic fraud attempts have grown 184% since 2019, and AI tools have accelerated the threat: synthetic identity document fraud increased 311% between Q1 2024 and Q1 2025 (Sumsub).
Auto lenders are the most exposed sector, with $2 billion in synthetic fraud losses in H1 2024 alone (TransUnion). Across all sectors, 8.3% of digital account creations were suspected fraudulent in H1 2025. Unlike traditional identity theft, synthetic fraud can go undetected for months or years because no individual victim reports the crime — the fabricated identity has no real person checking their credit.
| Finding | Value | Source |
|---|---|---|
| Lender exposure to synthetic ID fraud (2024) | $3.3B | TransUnion |
| Synthetic fraud growth since 2019 | 184% | TransUnion |
| AI-driven synthetic document fraud increase | 311% | Sumsub |
| Auto lender synthetic fraud losses (H1 2024) | $2B | TransUnion |
| Suspected fraudulent digital accounts | 8.3% | TransUnion |
Nathan House's Analysis: AI Is Supercharging Synthetic Fraud
The 311% increase in synthetic identity document fraud (Sumsub) is the most alarming stat in this section. Generative AI tools can now produce convincing synthetic identity documents — IDs, utility bills, pay stubs — at scale. Traditional verification methods that rely on document checks are becoming obsolete. The organisations that survive this shift will be the ones investing in behavioural analytics, device fingerprinting, and cross-source identity verification rather than relying on document-based KYC alone.
Auto Lending: Ground Zero for Synthetic Fraud
Auto lenders absorbed $2 billion in synthetic fraud losses in just the first half of 2024 (TransUnion). The auto lending industry is particularly vulnerable because loan applications require less identity verification than banking or mortgage products, approval processes prioritise speed, and vehicles are easily resold. This makes auto loans the preferred first credit product for synthetic identities building credit histories.
🔐 Credential Theft & Data Exposure
The raw material for identity theft is stolen personal data, and the scale is staggering. SpyCloud recaptured 53.3 billion distinct identity records circulating online in 2024 — a 22% increase from the prior year. The average consumer has 229 exposed data records on the dark web, including names, dates of birth, phone numbers, and in many cases Social Security numbers and bank details.
| Finding | Value | Source |
|---|---|---|
| Cookies leaked on underground markets | 94 billion | NordVPN Research |
| Distinct identity records on the web | 53.3 billion | SpyCloud 2025 Identity Exposure Report |
| Stolen session cookies (bypass MFA) | 17.3 billion | SpyCloud 2025 Identity Exposure Report |
| Monthly credential stuffing attempts | 26 billion | Akamai |
| Stolen login credentials exposed (record leak) | 16 billion | BlackFog |
| Credentials from infostealers (H1 2025) | 1.8 billion | SpyCloud |
| Average exposed records per consumer | 229 | SpyCloud 2025 Identity Exposure Report |
| Breaches via stolen credentials | 31% | Verizon DBIR 2024 |
Nathan House's Analysis: Session Cookies Are the New Passwords
17.3 billion stolen session cookies circulate on the dark web (SpyCloud). These cookies allow attackers to bypass passwords AND multi-factor authentication entirely — they hijack an already-authenticated session. This is why credential-based attacks now initiate 31% of breaches (Verizon). MFA remains essential (it blocks 99% of basic attacks), but organisations need to layer session management, anomaly detection, and continuous authentication to address the cookie theft vector.
🎯 How Identity Theft Happens
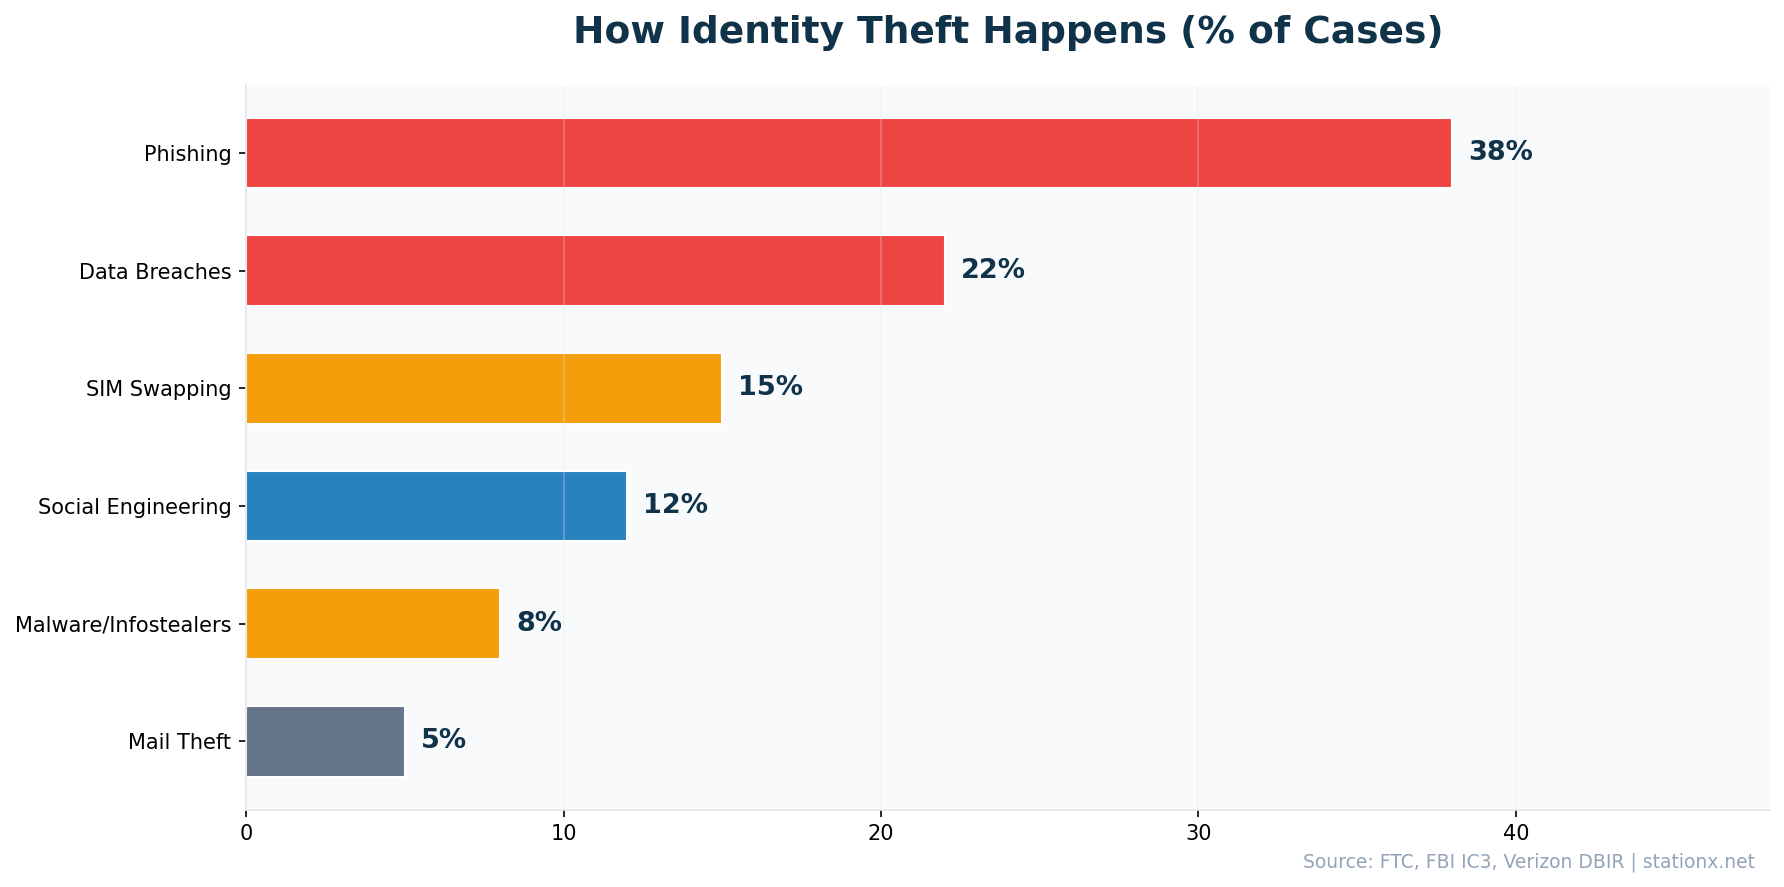
Stolen credentials initiate 31% of all data breaches (Verizon DBIR). Infostealers — malware designed to harvest login credentials, session cookies, and financial data — surged 58% in 2024 (KnowBe4). Smishing and vishing now account for 19% of breaches. But the most dramatic growth was in SIM swap fraud, which surged 1,055% (Infisign).
SIM swapping — where attackers convince a mobile carrier to transfer a victim's phone number to a new SIM — has exploded because it defeats SMS-based two-factor authentication. Once an attacker controls the phone number, they receive the victim's 2FA codes and can reset passwords on banking, email, and crypto accounts.
| Finding | Value | Source |
|---|---|---|
| Breaches via stolen credentials | 31% | Verizon DBIR 2024 |
| Breaches from smishing/vishing | 19% | Verizon DBIR 2025 |
| Infostealer infection attempts increase | 58% | KnowBe4 Financial Sector Threats Report 2025 |
| SIM swap fraud surge | 1,055% | Infisign |
| BYOD devices mixing work and personal credentials | 46% | Verizon DBIR 2025 |
| Enterprise machines in credential breach logs | 30% | Verizon DBIR 2025 |
The BYOD Risk: Work Meets Personal
46% of unmanaged BYOD devices mix work and personal credentials (Verizon DBIR). 30% of enterprise-licensed machines appear in credential breach logs. When employees reuse passwords across work and personal accounts, a breach of any personal service can become a corporate compromise. This blurs the line between personal identity theft and enterprise data breaches.
Nathan House's Analysis: The Infostealer Pipeline
The chain is clear: infostealers (+58%) harvest credentials and cookies, which feed 1.8 billion malware-sourced credentials into dark web markets (SpyCloud), where they fuel 26 billion monthly credential stuffing attempts (Akamai), which lead to account takeovers costing $16 billion (Javelin). Each link in this chain is growing. Blocking infostealers at the endpoint is the most cost-effective intervention point.
🛡️ Identity Theft Prevention & Recovery
Multi-factor authentication blocks 99% of unauthorized access attempts (Microsoft). Yet only 41% of organisations have fully adopted MFA (Microsoft Digital Defense Report). This gap between what works and what's deployed represents the single largest opportunity to reduce identity theft at scale.
For victims, recovery is painful. The Identity Theft Resource Center reports that victims spend an average of 200+ hours resolving identity theft — filing police reports, contacting creditors, disputing fraudulent accounts, and rebuilding credit. Javelin found the average resolution time is 10 hours (up from 6 hours in 2022), but this figure covers simple cases; complex cases involving new account fraud can take months.
Identity Theft Risk Assessment
Answer 8 questions to estimate your personal risk level. All answers stay in your browser.
| Finding | Value | Source |
|---|---|---|
| Unauthorized access blocked by MFA | 99% | Microsoft |
| MFA adoption rate | 41% | Microsoft Digital Defense Report 2024 |
| Average recovery hours for victims | 200+ | Identity Theft Resource Center |
| Average hours to resolve identity fraud | 10 | Javelin Strategy & Research 2025 Identity Fraud Study |
| Cost reduction with zero-trust architecture | $1.76M | IBM / UpGuard |
What Works
- MFA: blocks 99% of unauthorized access
- Credit freeze: prevents new account fraud
- Password manager: eliminates credential reuse
- Zero trust: saves $1.76M per breach (IBM)
What Doesn't Scale
- SMS-based 2FA: vulnerable to SIM swap
- Annual credit checks: too infrequent
- Security questions: easily researched
- Password complexity alone: ineffective
Nathan House's Analysis: The Prevention Gap Is the Problem
MFA blocks 99% of attacks but only 41% have adopted it. That 59% gap accounts for billions in preventable losses. The same pattern holds across identity theft prevention: credit freezes are free but underused, password managers are widely available but rarely adopted, and dark web monitoring services detect exposures that most consumers never check for. The tools exist. The adoption doesn't.
📝 Key Takeaways
- Identity theft is accelerating. FTC reports rose 9.5% in 2024 after two years of decline, driven by credit card fraud and new attack vectors.
- The real cost is $47 billion. Javelin's figure includes identity fraud ($27B) and scams ($20B), with account takeover alone responsible for $16B.
- Synthetic fraud is the fastest-growing threat. Up 184% since 2019 and supercharged by AI (311% increase in synthetic document fraud in one year).
- Millennials report more, but seniors lose more. 54% of Millennials have been victims, but over-60s lost $4.8 billion — the highest dollar amount by age group.
- Your data is already exposed. The average consumer has 229 exposed records on the dark web. 53.3 billion identity records are circulating online.
- MFA works but isn't deployed. It blocks 99% of attacks, yet only 41% have adopted it. Session cookies (17.3B stolen) can bypass it entirely.
- Credit card fraud dominates reports. 449,032 reports in 2024 (39.6% of all identity theft), with 90% involving new card openings.
- Prevention tools exist. Credit freezes, password managers, phishing-resistant MFA, and dark web monitoring can dramatically reduce risk — but adoption lags behind availability.
❓ Frequently Asked Questions
How common is identity theft?
The FTC received 1,135,270 identity theft reports in 2024 — approximately 130 reports per hour, every hour, every day. Javelin estimates 40 million Americans were affected by identity fraud or scams in 2024, meaning roughly 1 in 8 US adults experienced some form of identity-related crime.
What is the most common type of identity theft?
Credit card fraud is the most commonly reported type of identity theft, with 449,032 FTC reports in 2024 (39.6% of all identity theft complaints). In 90% of cases, criminals opened new credit cards using stolen personal information rather than compromising existing accounts.
How much does identity theft cost victims?
Total US identity fraud and scam losses reached $47 billion in 2024 (Javelin). On average, identity fraud victims lose approximately $1500 per incident. Beyond financial losses, victims spend an average of 200+ hours on recovery (ITRC), including filing reports, disputing accounts, and rebuilding credit.
What age group is most affected by identity theft?
Adults aged 30-39 file the most identity theft reports. Millennials have the highest victim rate at 54% (Javelin). However, victims aged 60+ suffer the largest financial losses — $4.8 billion total in 2024 (FBI IC3). Baby Boomers report less frequently (41%) but lose more per incident, particularly through bank account fraud.
Which state has the most identity theft?
Florida has the highest per-capita identity theft rate at 528 reports per 100,000 residents (FTC 2024), holding the #1 position for four consecutive years. Georgia is second at 517, followed by Nevada (466), Texas (393), and Delaware (392). Texas has the second-highest total number of reports due to its large population.
What is synthetic identity fraud?
Synthetic identity fraud involves combining real personal data (often stolen SSNs) with fabricated details to create new identities. US lender exposure reached $3.3 billion in 2024, an all-time high (TransUnion). Synthetic fraud has grown 184% since 2019 and is accelerating due to AI — synthetic identity document fraud increased 311% in one year (Sumsub). Auto lenders are the most exposed sector, absorbing $2 billion in losses in H1 2024.
About This Data
This article draws from 64 statistics aggregated from 50+ authoritative sources including IBM Cost of a Data Breach, Verizon DBIR, CrowdStrike Global Threat Report, WEF Global Cybersecurity Outlook, FBI IC3, ISC2 Cybersecurity Workforce Study, Sophos, Gartner, Mandiant M-Trends, and Ponemon Institute reports.
Derived statistics (marked "Nathan House's Analysis") are computed by cross-referencing data from multiple sources — for example, comparing breach costs across industries using IBM data, or validating ransomware trends across Verizon, Sophos, and HIPAA Journal findings.
All statistics include inline source citations with links to primary sources. Data spans 2023-2026, with preference given to the most recent available figures. Last updated: June 2026.
About the Author

Nathan House, Founder & CEO of StationX
Nathan House has 30 years of hands-on cybersecurity experience and is Cambridge-educated, holding CISSP, CISA, CISM, OSCP, CEH, and SABSA. He founded StationX in 1999 — one of the UK’s first cybersecurity companies — and has secured £71 billion in UK mobile banking transactions and the London 2012 Olympics, advising clients including Microsoft, Cisco, BP, Vodafone, and VISA. He authored the world’s most popular cybersecurity course — a #1 Udemy bestseller taken by over 500,000 students — and was named Cyber Security Educator of the Year 2020, AI Security Educator of the Year, and a UK Top 25 Security Influencer 2025. A DEF CON speaker and featured expert on CNN, Fox News, NBC, and the BBC, Nathan leads StationX’s training of more than half a million students worldwide.