Insider Threat Statistics [2026]: Costs, Trends & Key Data

$19.5 million per year. That is the average cost of insider-related incidents for a single organization in 2026, up 12% from $17.4 million the year before (Ponemon Institute / DTEX). Thirty percent of all data breaches involve internal actors (Verizon DBIR), and 76% of organizations report insider attacks are becoming more frequent (Securonix). The threat is not primarily malicious employees stealing secrets — 55% of insider incidents stem from negligence and mistakes.
You'll find 50+ insider risk statistics below across 12 sections — covering insider threat types (negligent insider threat vs malicious), insider threat by industry, detection timelines, remote-work risks, and prevention programs. Each section includes original cross-referenced analysis computed from Ponemon, Verizon DBIR, DTEX, CrowdStrike, and Proofpoint data that you will not find in any single report.
Key Insider Threat Statistics at a Glance
- $19.5 million — average annual insider risk cost per organization (Ponemon 2026)
- 30% of data breaches attributed to insiders (Verizon DBIR 2025)
- 67 days average time to contain an insider incident, down from 86 in 2023 (Ponemon)
- 55% of insider incidents caused by negligent employees, not malicious actors (Ponemon)
- $779,707 average cost of a single credential-theft insider incident (Ponemon)
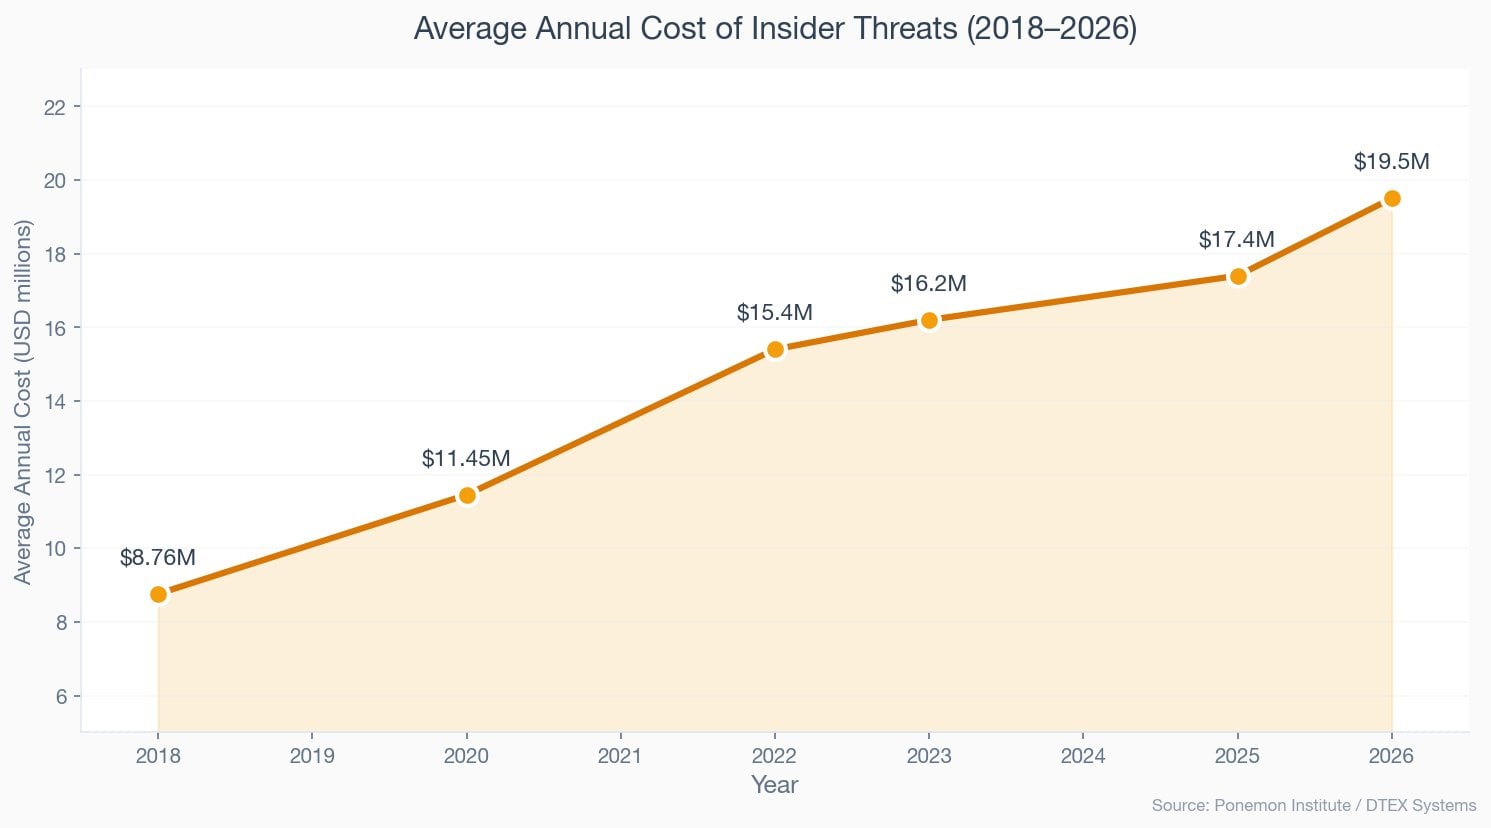
- 123% cost increase since 2018, from $8.76M to $19.5M per org (Ponemon)
- $28.8 million — healthcare sector's annual insider threat cost, highest of any industry (Ponemon)
- 81% of organizations have or are planning insider risk management programs (Ponemon)
Last updated: June 2026
📊 Key Insider Threat Numbers (2026)
$19.5 million per year. That is what routine insider activity costs the average organization in 2026, a 12% jump from $17.4 million in 2025 (Ponemon Institute / DTEX). Since 2018, the cost has risen 123%, more than doubling from $8.76 million. Organizations face an average of 13.5 insider threat events annually, and 76% report the frequency is increasing (Securonix 2025).
The containment picture is improving: organizations now take 67 days on average to contain an insider incident, down from 86 days in 2023 (Ponemon 2026). But speed alone does not tell the full story. Seventy-five percent of insider incidents are non-malicious, driven by negligence and credential theft rather than deliberate sabotage (Ponemon 2025). The data shows insiders are not primarily disgruntled employees stealing secrets — they are your everyday workforce making mistakes in increasingly complex digital environments.
| Finding | Value | Source |
|---|---|---|
| Average annual insider risk cost per org (2026) | $19.5M | Ponemon Institute / DTEX |
| Average annual insider risk cost per org (2025) | $17.4M | Ponemon Institute / DTEX 2025 Cost of Insider Risks Report |
| Data breaches attributed to insiders | 30% | Verizon DBIR 2025 |
| Average days to contain insider incident (2026) | 67 days | Ponemon Institute / DTEX 2026 Cost of Insider Risks Report |
| Average days to contain insider incident (2025) | 81 days | Ponemon Institute / DTEX 2025 Cost of Insider Risks Report |
| Average insider events per organization annually | 13.5 | Ponemon Institute / DTEX 2025 Cost of Insider Risks Report |
| Organizations reporting more frequent insider attacks | 76% | Securonix |
| Insider incidents that are non-malicious | 75% | Ponemon / DTEX 2025 |
| Cost increase since 2018 | 123% | Ponemon Institute |
Nathan House's Analysis: The Cost Acceleration Problem
Insider threat costs have risen 123% since 2018 ($8.76M to $19.5M), outpacing inflation and most other cybersecurity cost categories. Cross-referencing Ponemon data with IBM breach costs shows insider-originated breaches cost roughly the same per incident as external attacks — but organizations face 13.5 insider events per year versus significantly fewer successful external breaches. Volume, not severity, drives the total cost.
💰 Cost of Insider Threats
Insider risk now costs organizations an average of $19.5 million annually, up from $17.4 million in 2025 and $8.76 million in 2018 (Ponemon / DTEX). The bulk of this cost comes from negligent insiders, who generate $10.3 million in annualized cost per organization. Credential theft incidents are the most expensive on a per-event basis at $779,707, followed by malicious insiders at $715,366 and negligent insiders at $676,517 (Ponemon 2025).
Containment alone costs an average of $247,587 per incident. The total cost picture is driven by volume: organizations experience 13.5 insider events per year on average. When you multiply the per-incident cost by the frequency, the annual figure becomes clear — and it explains why 81% of organizations now have or are planning formal insider risk management programs (Ponemon 2025).
| Finding | Value | Source |
|---|---|---|
| Annual insider risk cost per org (2026) | $19.5M | Ponemon Institute / DTEX |
| Annual insider risk cost per org (2025) | $17.4M | Ponemon Institute / DTEX 2025 Cost of Insider Risks Report |
| Annual insider risk cost per org (2023) | $16.2M | Ponemon Institute / DTEX 2023 Cost of Insider Risks Report |
| Annual insider risk cost per org (2022) | $15.4M | Ponemon Institute |
| Annual insider risk cost per org (2020) | $11.45M | Ponemon Institute |
| Annual insider risk cost per org (2018) | $8.76M | Ponemon Institute |
| Average cost per insider incident (all types) | $676,517 | Ponemon / DTEX 2025 |
| Average cost per credential theft incident | $779,707 | Ponemon / DTEX 2025 |
| Average cost per malicious insider incident | $715,366 | Ponemon Institute / DTEX 2025 Cost of Insider Risks Report |
| Average cost per negligent insider incident | $676,517 | Ponemon Institute / DTEX 2025 Cost of Insider Risks Report |
| Average containment cost per incident | $247,587 | Ponemon Institute / DTEX 2025 Cost of Insider Risks Report |
Budget Share Doubled in Two Years
Organizations now spend 16.5% of their IT security budget on insider risk management, up from 8.2% in 2023 — a 101% increase (Ponemon). This shift reflects a fundamental change in how organizations prioritize internal threats versus perimeter defense. For a company with a $10M security budget, that is $1.65M dedicated to insider risk, up from $820K just two years ago.
Insider Risk Cost Calculator
Estimate your annual insider risk exposure based on Ponemon Institute data.
👥 Types of Insider Threats
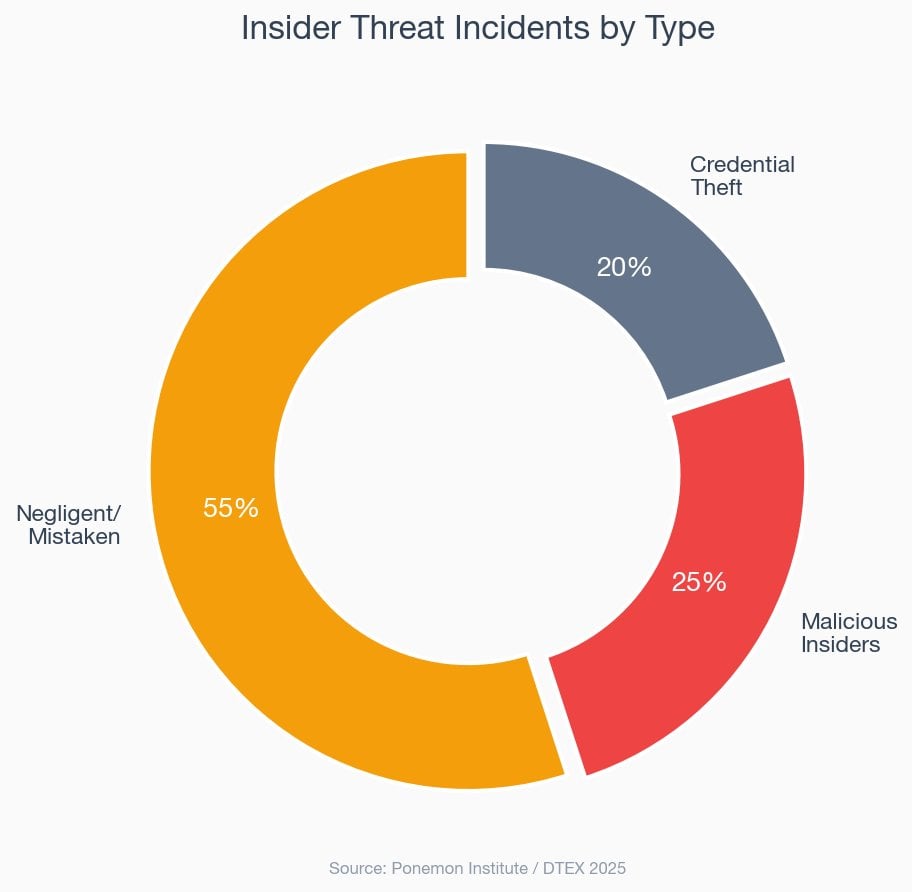
55% of insider incidents stem from negligent or mistaken employees, not malicious actors (Ponemon 2025). Add credential theft (20%), and 75% of all insider incidents are non-malicious. The remaining 25% are deliberate — data theft, sabotage, or fraud by employees who knowingly violate policy.
Despite being less common, malicious insider incidents cost $715,366 each, 5.7% more than negligent incidents at $676,517. Credential theft is the costliest per event at $779,707 — 15% more than a negligent incident. The difference reflects the complexity of detecting stolen credentials and the damage attackers can do with legitimate access.
| Finding | Value | Source |
|---|---|---|
| Incidents caused by negligent/mistaken insiders | 55% | Ponemon Institute / DTEX 2025 Cost of Insider Risks Report |
| Non-malicious incidents (negligent + credential theft) | 75% | Ponemon / DTEX 2025 |
| Annualized cost from negligent insiders | $10.3M | Ponemon / DTEX 2025 |
| Annualized cost from malicious insiders | $3.7M | Ponemon Institute / DTEX 2025 Cost of Insider Risks Report |
| Cost per credential theft incident | $779,707 | Ponemon / DTEX 2025 |
| Cost per malicious insider incident | $715,366 | Ponemon Institute / DTEX 2025 Cost of Insider Risks Report |
| Cost per negligent insider incident | $676,517 | Ponemon Institute / DTEX 2025 Cost of Insider Risks Report |
Insider Threat Type Explorer
Select a threat type to see its cost profile and characteristics.
Nathan House's Analysis: The Negligence Paradox
Negligent insiders cost the least per incident ($676,517) but generate the highest total annual cost ($10.3M) because they account for 55% of all events. Malicious insiders cost more per incident ($715,366) but generate far less total damage ($3.7M) because they are rarer. The implication: prevention spending should heavily weight training and process controls over surveillance, since the majority of losses come from carelessness, not intent.
📈 How Common Are Insider Threats?
30% of all data breaches involve internal actors (Verizon DBIR 2025). In EMEA, the figure is even higher at 29% from within the organization alone. Organizations experience an average of 13.5 insider threat events per year, and 76% report the frequency is increasing (Securonix 2025). Among businesses that track insider incidents, 48% say they are experiencing frequent attacks (Cybersecurity Insiders 2024).
74% of organizations report that insider threats have become more frequent over the past 12 months (VikingCloud 2025). The increase is driven by remote work expansion, cloud adoption, and the proliferation of data across SaaS platforms. As the attack surface for insiders grows, so does the volume of incidents.
| Finding | Value | Source |
|---|---|---|
| Data breaches attributed to insiders globally | 30% | Verizon DBIR 2025 |
| Organizations reporting more frequent insider attacks | 76% | Securonix |
| Organizations reporting increasing insider frequency | 74% | Cybersecurity Insiders / VikingCloud |
| Businesses experiencing frequent insider attacks | 48% | Cybersecurity Insiders |
| Average insider threat events per org annually | 13.5 | Ponemon Institute / DTEX 2025 Cost of Insider Risks Report |
| EMEA breaches from internal actors | 29% | Verizon DBIR 2025 |
Regional Variation in Insider Threats
Verizon DBIR 2025 reveals dramatic regional differences: 29% of EMEA breaches originate from internal actors, compared to just 5% in North America and 1% in APAC. This is not because EMEA employees are more malicious — it reflects stricter data-handling regulations (GDPR) that require organizations to classify more incidents as internal breaches. The takeaway: regional compliance frameworks directly shape how insider threats are measured and reported.
⏱️ Insider Threat Detection and Containment
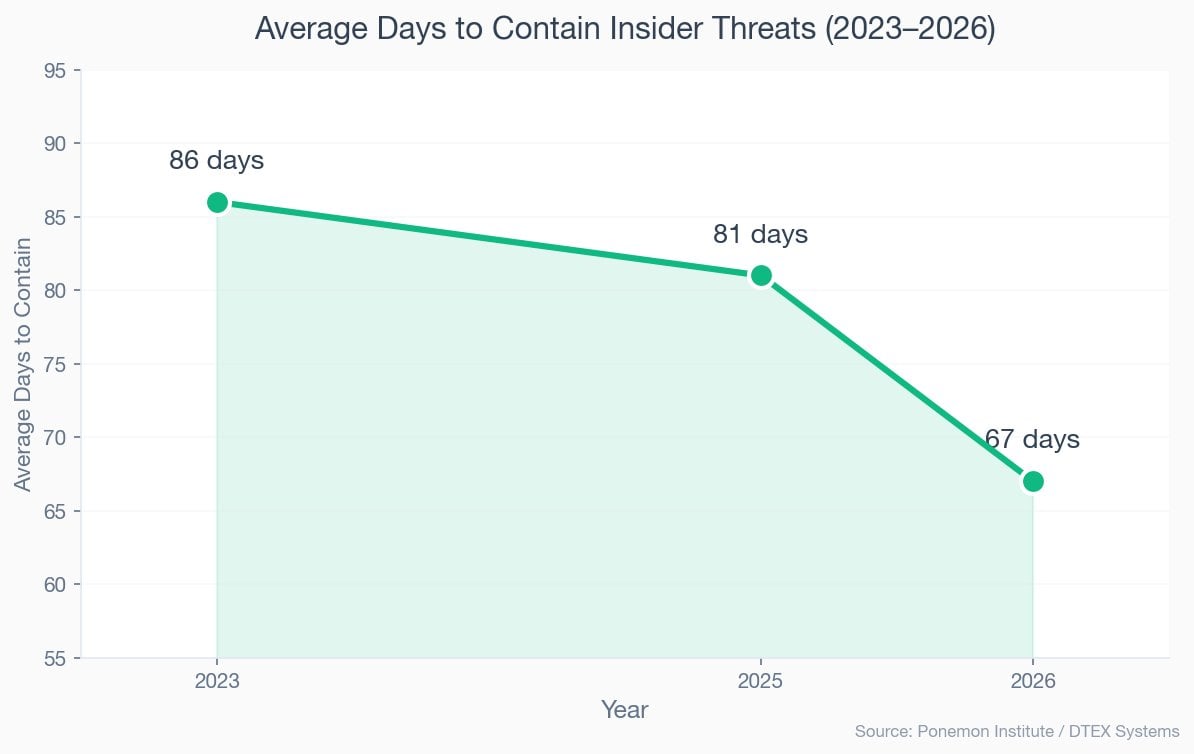
67 days. That is how long it takes to contain the average insider threat incident in 2026, down from 81 days in 2025 and 86 days in 2023 (Ponemon / DTEX). The improvement correlates with increased investment in insider risk programs and AI-powered detection tools. But 53% of organizations still find insider incidents harder to detect than external threats (Cybersecurity Insiders 2025).
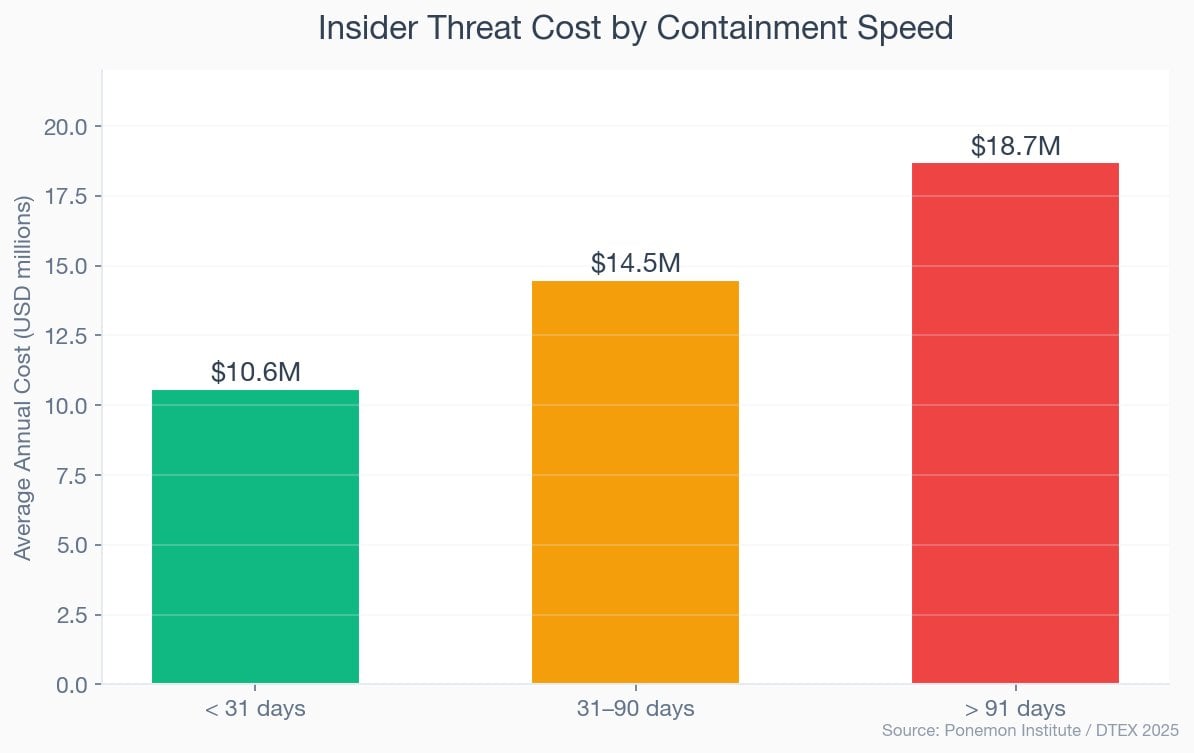
Speed matters enormously. Incidents contained within 31 days cost $10.6 million annually, while those taking more than 91 days cost $18.7 million — 76% more (Ponemon 2025). Yet only 12% of insider incidents are contained within 31 days. Each day of delay costs roughly $214,815 based on the average annual cost and containment timeline.
| Finding | Value | Source |
|---|---|---|
| Average days to contain (2026) | 67 days | Ponemon Institute / DTEX 2026 Cost of Insider Risks Report |
| Average days to contain (2025) | 81 days | Ponemon Institute / DTEX 2025 Cost of Insider Risks Report |
| Average days to contain (2023) | 86 days | Ponemon Institute / DTEX 2023 Cost of Insider Risks Report |
| Cost when contained in < 31 days | $10.6M | Ponemon Institute / DTEX 2025 Cost of Insider Risks Report |
| Cost when containment takes > 91 days | $18.7M | Ponemon Institute / DTEX 2025 Cost of Insider Risks Report |
| Incidents contained within 31 days | 12% | Ponemon Institute / DTEX 2025 Cost of Insider Risks Report |
| Average containment cost per incident | $247,587 | Ponemon Institute / DTEX 2025 Cost of Insider Risks Report |
| Organizations finding insider detection harder than external | 53% | Cybersecurity Insiders |
Nathan House's Analysis: The 31-Day Threshold
Only 12% of insider incidents are contained within 31 days, yet those that are cost $10.6M compared to $18.7M for incidents taking 91+ days — a 76% premium for slow response. Cross-referencing with the 42% AI adoption rate for insider detection, there is a clear gap: organizations using behavioral analytics and AI close incidents faster. The 88% of incidents taking longer than 31 days represent the clearest ROI case for investment in detection technology.
🏭 Insider Threat Cost by Industry
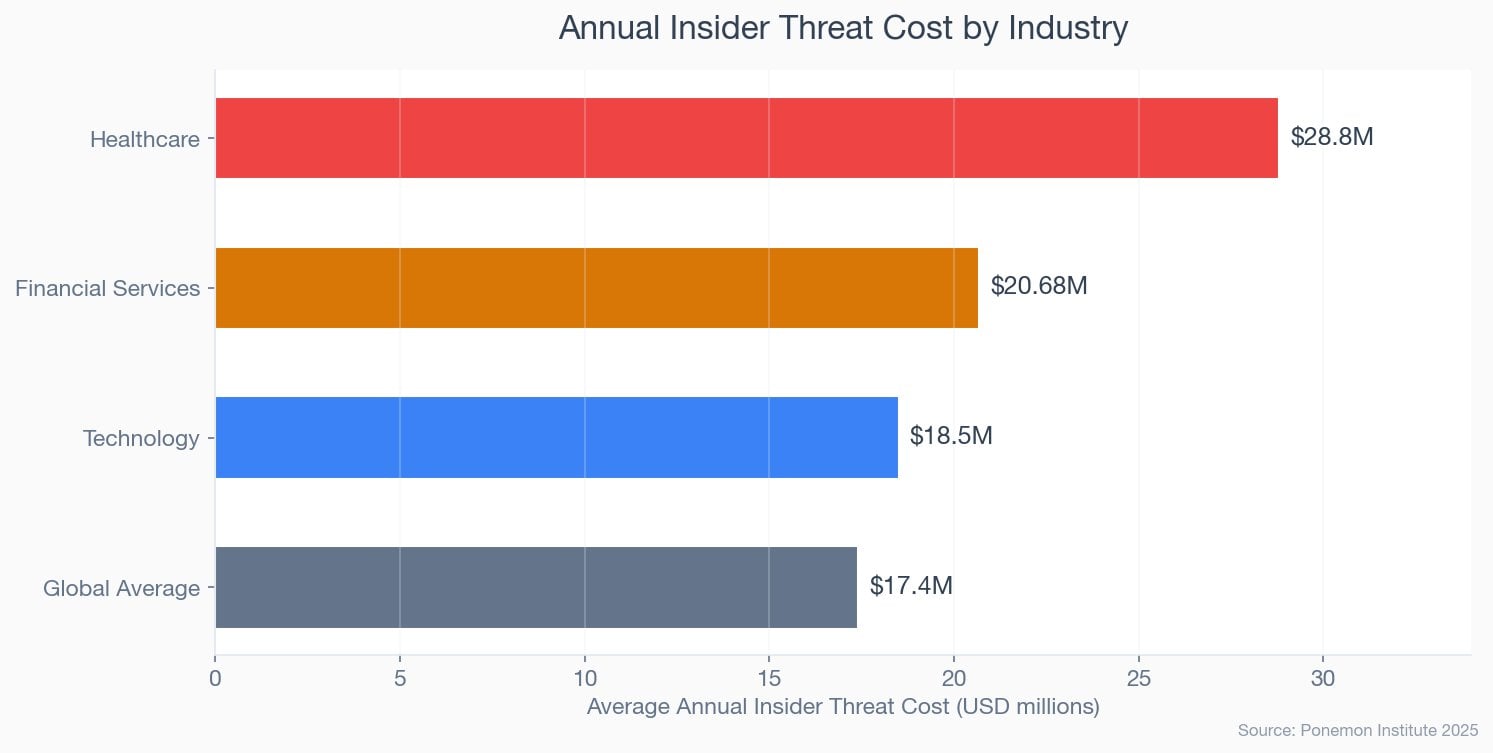
$28.8 million per year. That is what insider threats cost healthcare organizations — 1.7x the global average of $17.4 million (Ponemon 2025). Financial services comes second at $20.68 million, 1.2x the global average. Both industries handle large volumes of regulated personal data, making insider incidents disproportionately expensive due to regulatory fines, notification requirements, and litigation costs.
Healthcare's dominance is driven by the value of patient records and strict HIPAA enforcement. In financial services, the combination of high-frequency insider incidents (3.8 per month on average) and the sensitivity of financial data pushes costs well above other sectors. Technology companies face the third-highest costs due to intellectual property theft risk.
| Finding | Value | Source |
|---|---|---|
| Healthcare annual insider threat cost | $28.8M | Ponemon Institute |
| Financial services annual insider threat cost | $20.68M | Ponemon Institute |
| Global average annual insider threat cost | $17.4M | Ponemon Institute / DTEX 2025 Cost of Insider Risks Report |
Highest Insider Threat Costs
- Healthcare: $28.8M/year (1.7x global avg)
- Financial Services: $20.68M/year
- Technology: $18.5M/year
Why These Industries Lead
- Regulated personal data (HIPAA, PCI DSS)
- High-frequency insider incidents
- Intellectual property theft exposure
Healthcare: The Insider Threat Capital
Healthcare organizations spend $28.8M annually on insider-related incidents — 1.7x the $17.4M global average. Cross-referencing with IBM data showing healthcare as the costliest industry for data breaches ($11.2M per breach), insiders represent a disproportionate share of that cost. The combination of valuable patient records, complex access requirements for care delivery, and heavy regulatory penalties creates a uniquely expensive insider risk profile.
⚖️ Negligent vs Malicious Insider Threats
$10.3 million in annual cost from negligent insiders versus $3.7 million from malicious insiders (Ponemon 2025). The numbers challenge the common assumption that intentional theft is the primary insider risk. Negligent employees account for 55% of all insider incidents and generate 2.8x the total annual cost of malicious actors, despite costing less per individual incident.
On a per-incident basis, the hierarchy inverts. Credential theft costs $779,707 per event, malicious actions cost $715,366, and negligence costs $676,517. The gap between the costliest (credential theft) and least costly (negligence) per incident is 15%. But because negligent incidents outnumber malicious ones by a ratio of roughly 2:1, total negligence costs dwarf intentional ones.
| Finding | Value | Source |
|---|---|---|
| Share of incidents from negligent insiders | 55% | Ponemon Institute / DTEX 2025 Cost of Insider Risks Report |
| Annual cost from negligent insiders | $10.3M | Ponemon / DTEX 2025 |
| Annual cost from malicious insiders | $3.7M | Ponemon Institute / DTEX 2025 Cost of Insider Risks Report |
| Cost per negligent incident | $676,517 | Ponemon Institute / DTEX 2025 Cost of Insider Risks Report |
| Cost per malicious incident | $715,366 | Ponemon Institute / DTEX 2025 Cost of Insider Risks Report |
| Cost per credential theft incident | $779,707 | Ponemon / DTEX 2025 |
Negligent Insiders (55% of incidents)
- $676,517 per incident
- $10.3M annual cost per org
- Accidental exposure, misconfiguration, lost devices
- Addressable through training and process controls
Malicious Insiders (25% of incidents)
- $715,366 per incident
- $3.7M annual cost per org
- Intentional data theft, sabotage, fraud
- Requires monitoring, access controls, DLP
Nathan House's Analysis: Where to Spend Your Budget
The data strongly suggests that organizations should weight insider risk budgets toward negligence prevention (training, process automation, DLP) rather than surveillance-heavy approaches targeting malicious actors. Negligent insiders generate $10.3M in annual costs vs $3.7M from malicious insiders. A 20% reduction in negligent incidents would save $2.06M — equivalent to eliminating more than half of all malicious insider costs. The ROI on training and process controls is substantially higher than the ROI on behavioral surveillance.
🏠 Insider Threats and Remote Work
Remote workers are 3x more likely to accidentally expose data than office-based employees (Cybersecurity Insiders 2025). 52% of security incidents in 2025 involved a remote worker's device or connection, and 78% of insider-style incidents involved cloud resources or SaaS platforms rather than on-premises systems (CrowdStrike).
The shift to cloud and SaaS means insider threats have moved beyond the traditional endpoint. Attackers targeting insiders now focus on platforms like Microsoft 365, AWS consoles, and Salesforce, where a single compromised credential can expose vast amounts of data without triggering endpoint detection. The combination of remote work and cloud migration has expanded the insider threat surface significantly.
| Finding | Value | Source |
|---|---|---|
| Remote workers vs office: data exposure likelihood | 3x | Cybersecurity Insiders |
| Security incidents involving remote worker device | 52% | Cybersecurity Insiders |
| Insider incidents involving cloud/SaaS platforms | 78% | CrowdStrike / Cybersecurity Insiders |
The Cloud Migration Blind Spot
78% of insider incidents now involve cloud or SaaS platforms, yet most insider threat programs were designed for on-premises environments. Cross-referencing with the 42% AI adoption rate for insider detection, more than half of organizations lack AI-powered visibility into cloud-based insider activity. The gap is widening as organizations migrate more data to cloud platforms without extending their insider monitoring capabilities.
🛡️ Insider Threat Prevention and Programs
81% of organizations now have or are planning insider risk management programs, up significantly from previous years (Ponemon 2025). Organizations with formal programs avoid roughly 7 incidents and $8.2 million in breach costs per year compared to those without (Ponemon 2026). 65% of organizations with programs say it was the only security strategy that enabled them to pre-empt a data breach by detecting insider risk early.
Budget allocation has shifted accordingly. Organizations now dedicate 16.5% of their IT security budget to insider risk management, up from 8.2% in 2023 — a 101% increase in just two years (Ponemon 2025). The leading drivers of insider risk in 2026 are lack of training and awareness (37%), data proliferation (36%), and cloud/web exposure (30%) (Ponemon 2026).
| Finding | Value | Source |
|---|---|---|
| Organizations with or planning insider risk program | 81% | Ponemon Institute / DTEX 2025 Cost of Insider Risks Report |
| IT security budget on insider risk (2025) | 16.5% | Ponemon Institute / DTEX 2025 Cost of Insider Risks Report |
| IT security budget on insider risk (2023) | 8.2% | Ponemon Institute / DTEX 2023 Cost of Insider Risks Report |
| Annual breach costs avoided with formal program | $8.2M | Ponemon Institute / DTEX 2026 Cost of Insider Risks Report |
| Incidents avoided per year with formal program | 7 | Ponemon Institute / DTEX 2026 Cost of Insider Risks Report |
| Orgs saying program was only strategy to pre-empt breach | 65% | Ponemon Institute / DTEX 2025 Cost of Insider Risks Report |
With Formal Insider Risk Program
- $8.2M fewer annual breach costs
- 7 fewer incidents per year
- 65% say it pre-empted breaches
- 16.5% of IT security budget allocated
Without Formal Program
- $8.2M more in annual exposure
- 7 additional incidents per year
- Reactive detection only
- Higher cost per incident
Nathan House's Analysis: The Program ROI Is Clear
Organizations with formal insider risk programs save $8.2M per year and avoid 7 incidents annually (Ponemon 2026). Against the average insider risk budget of 16.5% of a typical $10M IT security spend ($1.65M), the ROI is nearly 5:1. The 19% of organizations without programs or plans face the highest risk exposure — and the data suggests they are paying for it through higher incident costs and slower containment times.
🤖 AI and Insider Threat Detection
42% of organizations now use AI to detect or prevent insider risks (Cybersecurity Insiders 2025). Reduced false positives rank among the most frequently cited benefits. Cross-referencing with IBM breach data, organizations extensively using AI and automation save $1.9 million per breach and shorten detection by 80 days.
But AI is a double-edged sword. 60% of organizations express high concern about the misuse of AI tools by insiders, with leading worries including deepfake-assisted social engineering (69% of concerned organizations), automated data exfiltration (61%), and AI-assisted credential abuse (53%) (Proofpoint 2026). Shadow AI — employees using unauthorized AI tools that process corporate data — is emerging as a new insider risk category that most programs are not yet equipped to monitor.
| Finding | Value | Source |
|---|---|---|
| Organizations using AI for insider risk detection | 42% | Cybersecurity Insiders |
| Organizations concerned about AI misuse by insiders | 60% | Proofpoint |
| Lack of training as leading insider risk driver | 37% | Ponemon Institute / DTEX 2026 Cost of Insider Risks Report |
| Data proliferation as leading insider risk driver | 36% | Ponemon Institute / DTEX 2026 Cost of Insider Risks Report |
Shadow AI: The Emerging Insider Risk
The 2026 Ponemon/DTEX report highlights shadow AI as a growing blind spot. Employees using unauthorized AI tools like ChatGPT or Claude with corporate data create data exfiltration channels that traditional DLP and insider monitoring tools cannot see. Combined with the 60% of organizations concerned about AI misuse by insiders (Proofpoint), this creates a gap between risk awareness and detection capability that will define the next phase of insider threat management.
Insider Threat Readiness Assessment
Answer 8 questions to assess your organization's insider threat readiness.
1. Does your organization have a formal insider risk management program?
2. Do you use AI or behavioral analytics for insider threat detection?
3. How often do employees receive insider threat awareness training?
4. Do you monitor privileged user activity?
5. Do you have DLP (Data Loss Prevention) controls in place?
6. Is there a documented incident response plan for insider threats?
7. Do you apply least-privilege access controls?
8. Do you have offboarding procedures that revoke access immediately?
📋 Key Takeaways
- Costs are accelerating. Insider risk costs have risen 123% since 2018, reaching $19.5M per organization in 2026. The trend shows no sign of slowing.
- Most insider threats are accidental. 55% of incidents come from negligent employees, not malicious actors. Training and process controls offer the highest ROI for prevention.
- Containment speed determines cost. Incidents contained under 31 days cost $10.6M; those over 91 days cost $18.7M — a 76% premium. Only 12% achieve the 31-day target.
- Healthcare and financial services bear the highest burden. Healthcare faces $28.8M/year (1.7x global average); financial services faces $20.68M/year.
- Formal programs deliver clear ROI. Organizations with insider risk programs save $8.2M/year and avoid 7 incidents annually. 81% now have or plan such programs.
- Remote work and cloud adoption amplify risk. Remote workers are 3x more likely to expose data; 78% of insider incidents involve cloud/SaaS platforms.
- AI is both solution and problem. 42% use AI for insider detection, but 60% are concerned about AI misuse by insiders. Shadow AI is the emerging blind spot.
❓ Frequently Asked Questions
What percentage of data breaches are caused by insider threats? ▼
30% of all data breaches involve internal actors, according to the Verizon DBIR 2025. In EMEA specifically, 29% of breaches originate from within the organization. Globally, organizations experience an average of 13.5 insider threat events per year (Ponemon 2025).
How much do insider threats cost organizations? ▼
The average organization spends $19.5 million annually on insider-related incidents as of 2026 (Ponemon/DTEX 2026). This is up from $17.4 million in 2025 and $8.76 million in 2018 — a 123% increase over eight years. Individual incidents cost between $676,517 (negligent) and $779,707 (credential theft) per event.
What is the most common type of insider threat? ▼
Negligent or mistaken employees cause 55% of all insider incidents (Ponemon 2025). These include accidental data exposure, misconfigured systems, and lost devices. When combined with credential theft (20%), 75% of insider incidents are non-malicious. Only 25% involve intentional data theft, sabotage, or fraud.
How long does it take to detect an insider threat? ▼
The average time to contain an insider threat incident is 67 days in 2026, down from 86 days in 2023 (Ponemon/DTEX). Only 12% of incidents are contained within 31 days. Speed matters significantly: incidents contained within 31 days cost $10.6 million annually, while those taking over 91 days cost $18.7 million — 76% more.
How can organizations prevent insider threats? ▼
81% of organizations now have or are planning formal insider risk management programs (Ponemon 2025). The most effective approach combines: (1) regular security awareness training (the top risk driver is lack of training at 37%), (2) behavioral analytics and AI-powered detection (used by 42% of organizations), (3) least-privilege access controls, (4) Data Loss Prevention (DLP) tools, and (5) documented incident response plans. Organizations with formal programs save $8.2M annually and avoid 7 incidents per year (Ponemon 2026).
About This Data
This article draws from 50 statistics aggregated from 20+ authoritative sources including Ponemon Institute / DTEX Cost of Insider Risks Reports (2023-2026), Verizon Data Breach Investigations Report (2025), CrowdStrike Global Threat Report, Cybersecurity Insiders, Securonix, Proofpoint, and VikingCloud.
Derived statistics (marked "Nathan House's Analysis") are computed by cross-referencing data from multiple sources — for example, comparing per-incident costs across insider types, calculating cost acceleration rates, and correlating containment speed with total annual costs.
All statistics include inline source citations with links to primary sources. Data spans 2023-2026, with preference given to the most recent available figures. Last updated: June 2026.
About the Author

Nathan House, Founder & CEO of StationX
Nathan House has 30 years of hands-on cybersecurity experience and is Cambridge-educated, holding CISSP, CISA, CISM, OSCP, CEH, and SABSA. He founded StationX in 1999 — one of the UK’s first cybersecurity companies — and has secured £71 billion in UK mobile banking transactions and the London 2012 Olympics, advising clients including Microsoft, Cisco, BP, Vodafone, and VISA. He authored the world’s most popular cybersecurity course — a #1 Udemy bestseller taken by over 500,000 students — and was named Cyber Security Educator of the Year 2020, AI Security Educator of the Year, and a UK Top 25 Security Influencer 2025. A DEF CON speaker and featured expert on CNN, Fox News, NBC, and the BBC, Nathan leads StationX’s training of more than half a million students worldwide.