Cyber Security Breach Statistics [2026]: Key Facts & Data

$4.44 million. That is the global average cost of a single data breach in 2026, while the US leads at $10.22 million — an all-time high (IBM). Organizations take 241 days on average to identify and contain a breach, and 68% of breaches still involve a human element (Verizon DBIR 2025).
You'll find 140+ breach statistics across 12 sections below — from costs by country and industry to root causes, detection timelines, and emerging trends — sourced from IBM, Verizon, Surfshark, the FBI, and 30+ authoritative reports. Each section includes original cross-referenced analysis you won't find in any single source.
Key Breach Statistics at a Glance
- $4.44 million — average cost of a data breach in 2026, down 9% from $4.88M in 2024 (IBM)
- $10.22 million — US average breach cost, the highest globally and an all-time record (IBM)
- 241 days — average time to identify (181 days) and contain (60 days) a breach (IBM)
- 68% of breaches involve a human element: errors, social engineering, or misuse (Verizon DBIR)
- 88% of breaches are attributed to human error overall (Stanford University)
- 30% of breaches now involve third parties, doubled year-over-year (IBM)
- $1.9 million saved per breach when AI/automation is deployed (IBM)
- 3,322 US data breaches reported in 2024, a record high (ITRC/Barracuda)
Last updated: June 2026
📊 Key Breach Numbers (2026)
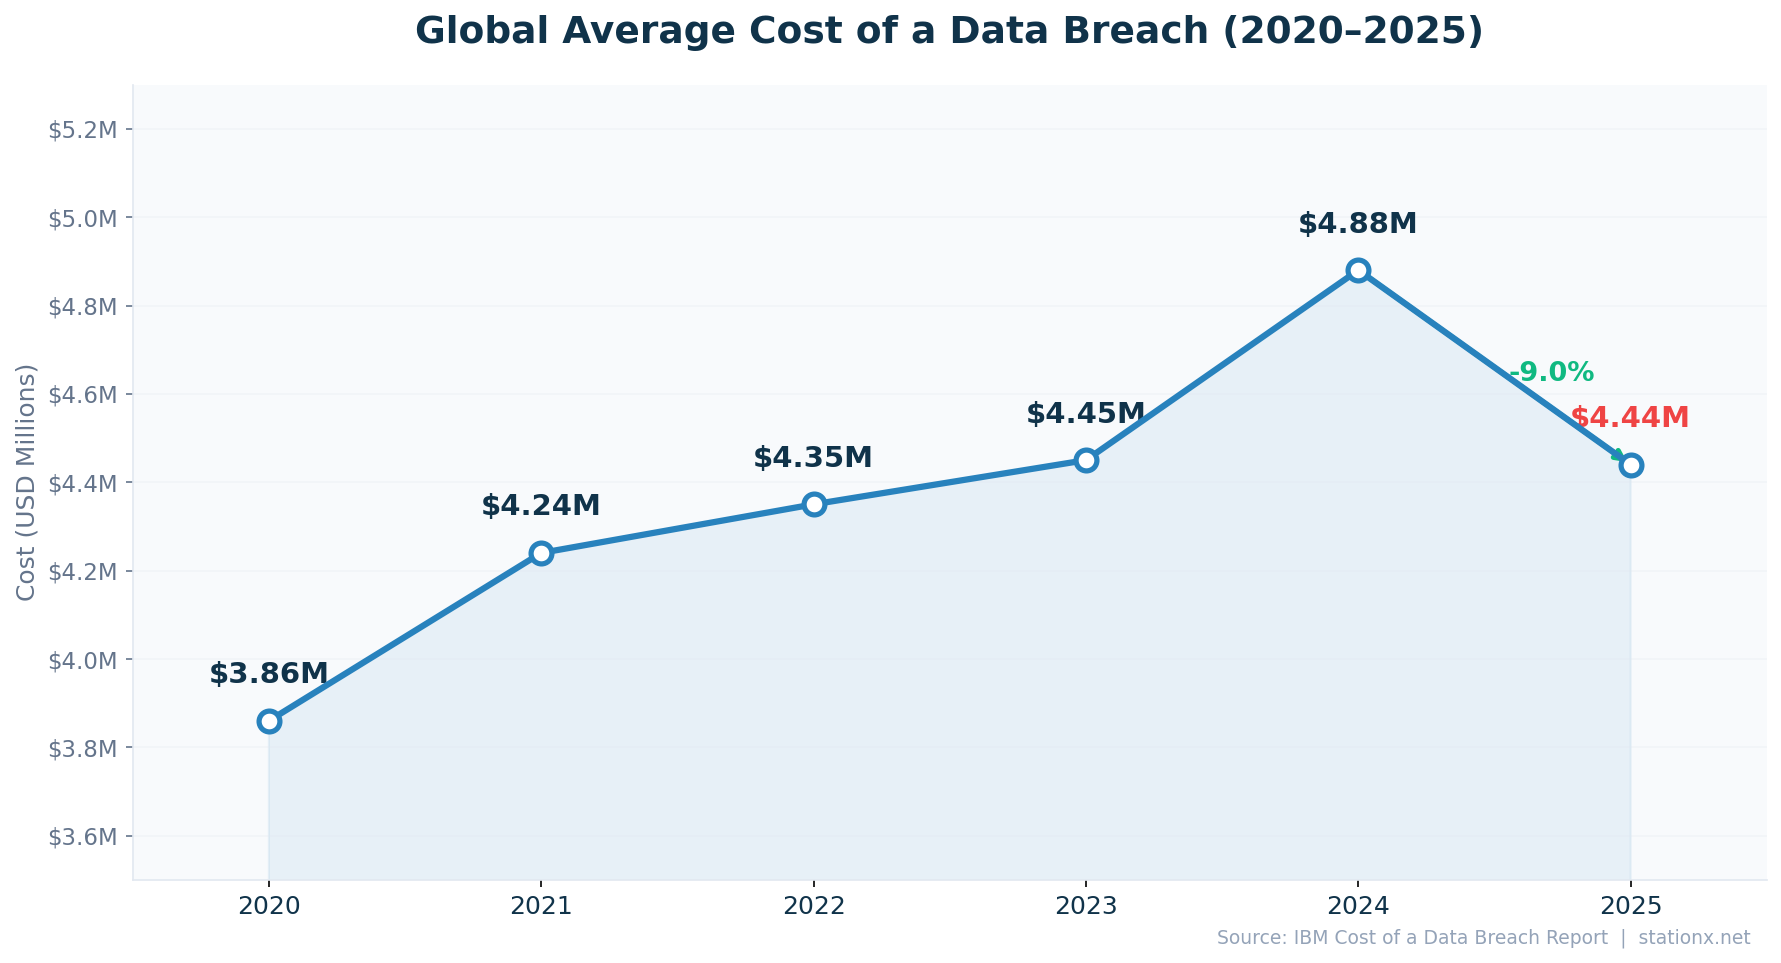
The global average cost of a data breach fell to $4.44 million in 2026, a 9% decline from $4.88 million in 2024 (IBM Cost of a Data Breach Report 2025). This marks the first significant decrease in five years of consecutive increases. The drop is largely attributed to widespread adoption of security AI and automation, which saved organizations an average of $1.9 million per breach.
Despite the global decline, the US hit an all-time record of $10.22 million per breach — 2.3x the global average. This divergence matters: while AI adoption is lowering costs globally, the US faces higher regulatory penalties, litigation costs, and notification requirements that push costs in the other direction. The average breach lifecycle remains 241 days, giving attackers nearly 8 months of dwell time (IBM 2025).
| Finding | Value | Source |
|---|---|---|
| Global average data breach cost (2025) | $4.44M | IBM Cost of a Data Breach Report 2025 |
| Global average breach cost (2024) | $4.88M | IBM Cost of a Data Breach Report 2024 |
| US average breach cost (all-time high) | $10.22M | IBM Cost of a Data Breach Report 2025 |
| Average breach lifecycle (identify + contain) | 241 days | IBM Cost of a Data Breach Report 2025 |
| Average cost per compromised record | $160 | IBM Cost of a Data Breach Report 2025 |
| Ransomware present in breaches | 44% | Verizon DBIR 2025 |
| Breaches involving human element | 68% | Verizon DBIR 2025 |
| Breaches caused by human error | 88% | Stanford University |
| Cost savings from security AI/automation | $1.9M | IBM Cost of a Data Breach Report 2025 |
| US data breaches (record high) | 3,322 | Barracuda Networks / ITRC |
Nathan House's Analysis: The 9% Drop Is Misleading
The global average fell, but the US — which dominates breach reporting — hit $10.22M, an all-time high. Cross-referencing IBM and Verizon data, the decrease is concentrated in regions with rapid AI security adoption. Organizations without AI/automation still pay $5.52M per breach, 24% above the global average. The real story isn't that breaches got cheaper — it's that the gap between AI-equipped and AI-deficient organizations widened to $1.9M.
How IBM Measures Breach Costs
IBM's Cost of a Data Breach Report is based on interviews with 604 organizations across 17 countries and regions that experienced breaches between March 2024 and February 2025. Costs include four components: detection and escalation ($1.47M), lost business ($1.47M), notification ($0.39M), and post-breach response ($1.11M). The methodology has been consistent for 19 years, making year-over-year comparisons reliable.
The $4.44M average is a mean, not a median — a small number of very costly breaches pull the average up. The median breach cost is substantially lower. This is important context: most organizations will face breach costs below the average, but the tail risk of a catastrophic breach (like the $2.87B Change Healthcare incident) means planning for the average alone is insufficient.
📈 How Often Do Data Breaches Happen?
Data breaches are accelerating in both frequency and scale. The US recorded 3,322 data breaches in 2024, a new record (ITRC/Barracuda 2025). A cyberattack occurs approximately every 39 seconds (Cobalt). Microsoft alone reports 600 million+ password attacks per day against its customers. The FBI's IC3 reported $16.6 billion in cybercrime losses in 2024, a 33% surge from $12.5 billion the prior year.
Supply chain and third-party breaches are a particular concern. IBM reports that 30% of breaches now involve third parties, a figure that doubled year-over-year. External actors remain responsible for the majority of breaches (IBM 2025), with organized crime groups driving the bulk of financially motivated attacks (Verizon DBIR 2025).
| Finding | Value | Source |
|---|---|---|
| US reported data breaches (2024, record) | 3,322 | Barracuda Networks / ITRC |
| Time between cyberattacks | 39 seconds | Cobalt / University of Maryland |
| Microsoft: password attacks per day | 600 million+ | Microsoft Digital Defense Report 2024 |
| Breaches involving third parties | 30% | IBM Cost of a Data Breach Report 2025 |
| Breaches caused by external actors | 70% | Verizon DBIR 2025 |
| Weekly cyberattacks on organizations | 1,968 | VikingCloud / Check Point Research |
| FBI IC3 reported losses (2024) | $16.6B | FBI Internet Crime Report 2024 |
| FBI IC3 reported losses (2023) | $12.5B | FBI Internet Crime Report 2023 |
Nathan House's Analysis: FBI Losses vs IBM Costs — Different Lenses on the Same Problem
The FBI reports $16.6B in losses (IC3 2024), while IBM calculates $4.44M average per breach from 604 surveyed organizations. These aren't contradictory — they measure different things. FBI IC3 captures reported losses from all cybercrime types (BEC, investment fraud, romance scams). IBM measures operational breach costs (detection, response, lost business, regulatory). Cross-referencing both: the total economic impact is far larger than either figure alone suggests.
Breach Volume Is Growing Faster Than Breach Cost
An important nuance in the 2026 data: while the average cost per breach dropped 9%, the total number of breaches continued rising. The US alone saw 3,322 breaches — a record. This means aggregate economic damage from breaches is likely higher than ever, even as individual incidents become slightly cheaper to resolve. The FBI's 33% increase in reported losses ($12.5B to $16.6B) confirms this: more breaches at slightly lower average cost equals more total damage.
The proliferation of attacks is driven by several factors: Ransomware-as-a-Service makes launching attacks cheap, AI lowers the cost of phishing campaigns, and the expanding attack surface (cloud, IoT, remote work) creates more entry points. Microsoft's 600M+ daily password attacks illustrate the scale — even at low success rates, the sheer volume guarantees a steady supply of compromised credentials.
Nathan House's Analysis: Total Damage Is Rising Despite Lower Per-Breach Costs
The headline '9% cost decline' masks rising aggregate damage. Cross-referencing: 3,322 US breaches at $10.22M average = $33.9B in US breach costs alone. In 2024: fewer breaches at $9.36M average = lower total. The 2025 total is higher despite the global average declining. For CISOs, this means two things: (1) your individual breach risk is slightly cheaper if you have AI/automation, but (2) the probability of being breached is higher than ever. Both dimensions matter for budget justification.
🌍 Breach Costs by Country & Region
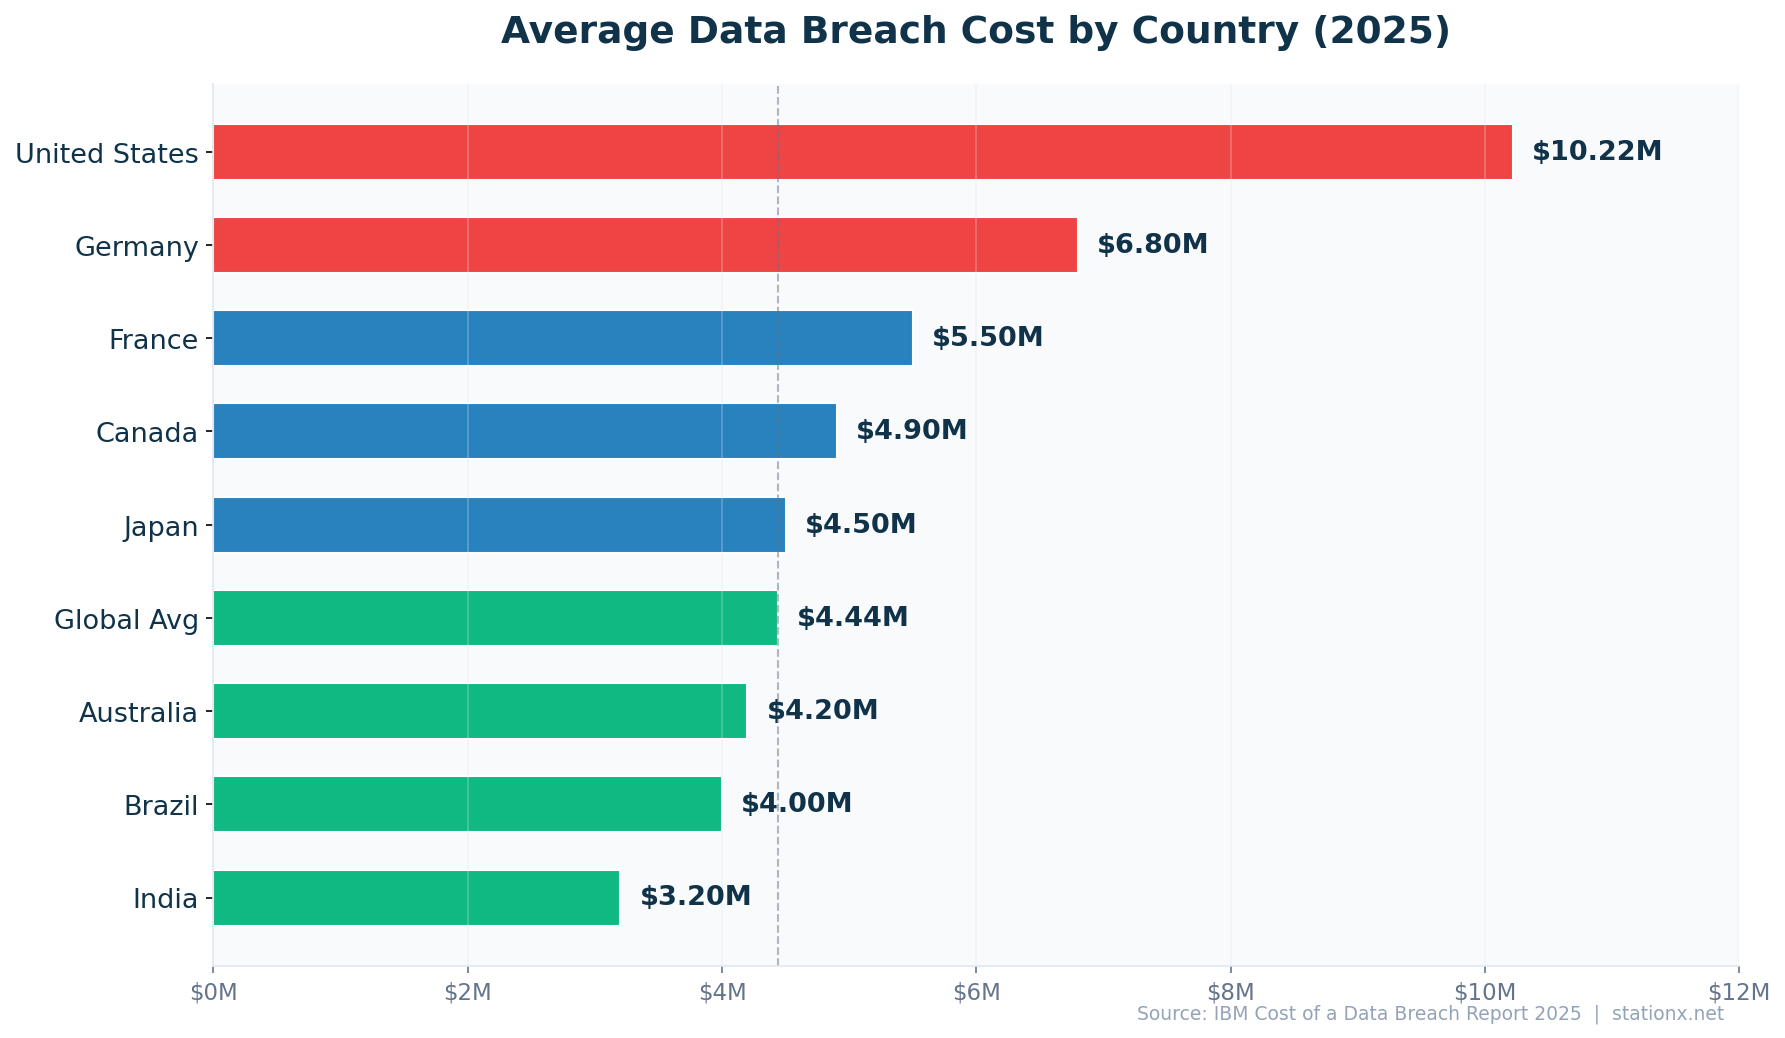
Breach costs vary 8.4x between the most and least expensive countries. The US leads at $10.22M — more than double the $4.44M global average — followed by the Middle East ($7.29M) and Benelux ($6.24M). At the bottom of IBM's ranking, Brazil ($1.22M) and South Africa ($2.37M) face lower per-incident costs but higher attack volumes. IBM surveyed 604 organizations across 17 countries and regions for its 2026 report.
All 16 Countries & Regions Ranked
Nathan House's Analysis: Why the US Costs So Much More
The US breach cost ($10.22M) is 2.3x the global average. Three factors drive this divergence: (1) litigation and class-action costs unique to the US legal system, (2) state-by-state notification requirements (50 different breach notification laws), and (3) higher healthcare and financial sector concentrations, which face the costliest breaches. Cross-referencing IBM and FBI data, the US also reports more breaches — 3,322 in 2024 alone — meaning higher aggregate costs even before the per-incident premium.
🇺🇸 United States — $10.22M (All-Time High)
US breach costs rose 9% year-over-year from $9.36M to $10.22M, reaching a new all-time high. The US has topped IBM's country rankings for 15 consecutive years. The increase is driven by escalating regulatory penalties, class-action litigation, and the concentration of high-cost sectors (healthcare at $11.2M, financial services at $6.08M). FBI IC3 reported $16.6 billion in total cybercrime losses for 2024, up 33% from $12.5B in 2023.
US Breach Cost Defies Global Trend
While global breach costs fell 9%, US costs rose 9%. The US legal environment — 50 state notification laws, HIPAA penalties, SEC disclosure rules, and class-action exposure — creates a cost floor that AI automation alone cannot eliminate. Organizations operating in the US face structural cost pressures regardless of their security maturity.
🇦🇪 Middle East — $7.29M (-18% YoY)
The Middle East saw the steepest drop of any region: 18% from $8.75M to $7.29M. Despite the decline, the region remains the second-costliest globally. Middle Eastern breach costs have historically been elevated by oil and gas sector targeting, rapid digital transformation, and high-value targets in financial services. The 18% decrease may reflect growing cybersecurity maturity following significant regional investments in security infrastructure.
🇪🇺 Europe — Mixed Picture
European breach costs tell divergent stories. Benelux ($6.24M, +6%) and Scandinavia ($3.80M, new entry) sit above the global average, reflecting high digital maturity and strict GDPR enforcement. The UK ($4.14M, -9%), Germany ($4.03M, -24%), France ($3.73M, -11%), and Italy ($3.44M, -27%) all saw significant declines. Germany's 24% drop is particularly notable, falling from $5.31M to $4.03M — the largest percentage decline in Europe.
Above Global Average
- Benelux: $6.24M (+6% YoY)
- Canada: $4.84M (+4% YoY)
- UK: $4.14M (-9% YoY)
Below Global Average
- Germany: $4.03M (-24% YoY)
- France: $3.73M (-11% YoY)
- Italy: $3.44M (-27% YoY)
Nathan House's Analysis: Germany and Italy — GDPR Enforcement Is Working
Germany's 24% drop ($5.31M to $4.03M) and Italy's 27% decline ($4.73M to $3.44M) are the steepest in IBM's dataset. Cross-referencing with GDPR enforcement data, both countries saw major regulatory actions in 2024 that forced organizations to improve breach response and notification processes. Faster response reduces downstream costs — IBM data shows breaches contained under 200 days cost $1.02M less. The European declines correlate with improved detection speed, not with fewer breaches.
🌏 Asia-Pacific — ASEAN Rising, Japan and South Korea Falling
ASEAN is the only APAC region where breach costs rose: up 14% from $3.23M to $3.67M, reflecting rapid digitalization in Southeast Asian economies without proportional security investment. Japan ($3.65M, -13%), South Korea ($2.84M, -22%), Australia ($2.55M, -8%), and India ($2.51M, +7%) show mixed trends. India's 7% increase to $2.51M is modest in absolute terms but represents growing cost pressure as Indian organizations face 3,195 weekly attacks per organization (SentinelOne) — the highest attack volume in IBM's dataset.
ASEAN: Digital Growth Outpacing Security Investment
ASEAN's 14% breach cost increase stands out against declining costs elsewhere. Singapore, Indonesia, Thailand, and the Philippines are digitizing rapidly — mobile banking, e-government, cloud migration — but security investment lags. The $3.67M average masks wide variation: Singapore faces higher costs than the ASEAN average, while developing ASEAN economies face lower costs but higher breach volumes.
🌎 Latin America — $3.81M (-8% YoY)
Latin America's breach costs declined 8% from $4.16M to $3.81M. The region faces growing ransomware threats but benefits from lower regulatory penalty structures compared to the US and EU. Brazil, which IBM tracks separately, saw a 10% decline to $1.22M — the lowest in the entire IBM dataset. This reflects lower cost-of-living adjustment factors and fewer regulatory penalties, not fewer breaches.
🇿🇦 South Africa — $2.37M (-15% YoY)
South Africa saw a 15% decline from $2.78M to $2.37M. The country faces significant cybercrime volumes driven by financial fraud and ransomware targeting financial institutions, but lower per-incident costs reflect the regional economic context. South Africa's POPIA (Protection of Personal Information Act) is driving improved data handling practices, though enforcement remains inconsistent.
Nathan House's Analysis: Cost ≠ Risk — The Brazil Paradox
Brazil has the lowest per-breach cost at $1.22M but faces massive attack volumes. Surfshark data shows Brazilian users are among the most breached globally. Low cost per incident reflects lower salaries, fewer class-action lawsuits, and weaker regulatory penalties — not better security. Organizations benchmarking against IBM's country data should note that low cost doesn't mean low risk. The 8.4x gap between US ($10.22M) and Brazil ($1.22M) is primarily a regulatory and legal cost differential, not a security maturity differential.
Year-over-Year Changes Across All 16 Regions
Of the 16 countries and regions in IBM's 2026 report, only four saw breach costs increase: the US (+9%), Benelux (+6%), ASEAN (+14%), Canada (+4%), and India (+7%). The remaining 11 regions all saw declines, with Italy (-27%), Germany (-24%), South Korea (-22%), and the Middle East (-18%) showing the steepest drops. Scandinavia appeared for the first time at $3.80M with no prior-year comparison available.
The divergence between rising US costs and falling costs elsewhere suggests two competing forces. In the US, regulatory complexity and litigation keep pushing costs higher regardless of security improvements. Elsewhere, AI adoption, GDPR-driven process improvements, and faster response times are reducing per-incident costs. The global average decline of 9% masks this structural divide.
Costs Rising
- 🇺🇸 United States: +9% ($9.36M → $10.22M)
- 🇸🇬 ASEAN: +14% ($3.23M → $3.67M)
- 🇮🇳 India: +7% ($2.35M → $2.51M)
- 🇧🇪 Benelux: +6% ($5.90M → $6.24M)
- 🇨🇦 Canada: +4% ($4.66M → $4.84M)
Costs Falling
- 🇮🇹 Italy: -27% ($4.73M → $3.44M)
- 🇩🇪 Germany: -24% ($5.31M → $4.03M)
- 🇰🇷 South Korea: -22% ($3.62M → $2.84M)
- 🇦🇪 Middle East: -18% ($8.75M → $7.29M)
- 🇿🇦 South Africa: -15% ($2.78M → $2.37M)
Nathan House's Analysis: The Regulatory Cost Floor
Cross-referencing all 16 regions reveals a clear pattern: countries with strong regulatory enforcement (US, Benelux) maintain high costs regardless of security improvements, while countries that improved detection speed saw costs drop. The US has 50 separate breach notification laws, SEC disclosure requirements, HIPAA, and an active class-action bar. Benelux faces aggressive GDPR enforcement from Dutch and Belgian DPAs. These regulatory environments create a cost floor that technology alone cannot eliminate. The lesson: breach cost optimization requires addressing both technical response and regulatory compliance simultaneously.
Country Data Explorer
Select a country to explore its cybersecurity landscape.
📝 Most Breached Countries by Records Leaked
Breach cost rankings and breach volume rankings tell different stories. Surfshark's Q1 2024 data shows Russia leading with 33.5 million breached accounts in a single quarter — 3.5x more than the US (9.6M) and 4.2x more than France (8.0M). Cumulatively, the US has the most leaked data points since 2004: 12.57 billion, followed by Russia (4.35 billion) and China (2.0 billion).
Breached Accounts (Q1 2024)
| Finding | Value | Source |
|---|---|---|
| 🇷🇺 Russia (Q1 2024) | 33.5M | Surfshark |
| 🇺🇸 United States (Q1 2024) | 9.6M | Surfshark |
| 🇫🇷 France (Q1 2024) | 8.0M | Surfshark |
| 🇺🇸 US cumulative leaks (2004-2024) | 12.57 billion | Surfshark / StationX Analysis |
| 🇷🇺 Russia cumulative leaks (2004-2024) | 4.35 billion | Surfshark / StationX Analysis |
| 🇨🇳 China cumulative leaks (2004-2024) | 2.0 billion | Surfshark / StationX Analysis |
| 🇫🇷 France cumulative leaks (2004-2024) | 1.41 billion | Surfshark / StationX Analysis |
Nathan House's Analysis: Russia — Costliest or Most Breached?
Russia leads in breached accounts (33.5M in Q1 2024) but doesn't appear in IBM's breach cost rankings at all. IBM surveys Western-aligned organizations; Russian breach costs are unmeasured in this dataset. The Surfshark data reveals a parallel breach ecosystem: Russia faces massive credential leaks from domestic services, while the US faces the highest per-incident costs from enterprise breaches. These are different threat surfaces requiring different defences.
Cumulative Data Leaks (2004-2024)
Looking at the full 20-year picture, the US has leaked 12.57 billion data points since 2004 — nearly 3x more than second-place Russia (4.35 billion). China (2.0 billion) and France (1.41 billion) round out the top four (Surfshark). The cumulative data is important because leaked credentials don't expire — they feed credential stuffing attacks for years. A breach from 2015 can still be exploited in 2026 if the victim hasn't changed their passwords.
The disconnect between cost rankings and volume rankings is instructive. France appears in both Surfshark's top 3 for breached accounts (8.0M in Q1 2024) and IBM's country cost data ($3.73M per breach). The US similarly dominates both lists. But Russia — the most breached by accounts — has no IBM cost data. India faces the highest weekly attack volumes (3,195 per organization) but has among the lowest per-incident costs ($2.51M). The lesson for security professionals: use the right metric for your specific question.
Most Breached (by Volume)
- 🇷🇺 Russia: 33.5M accounts (Q1 2024)
- 🇺🇸 US: 12.57B cumulative data points
- 🇫🇷 France: 8.0M accounts (Q1 2024)
Most Costly (per Incident)
- 🇺🇸 US: $10.22M per breach
- 🇦🇪 Middle East: $7.29M per breach
- 🇧🇪 Benelux: $6.24M per breach
🔐 What Causes Data Breaches?
68% of breaches involve a human element — errors, social engineering, stolen credentials, or privilege misuse (Verizon DBIR 2025). Stanford University puts the broader human error figure at 88%. The costliest initial attack vectors are malicious insiders ($4.92M per breach), supply chain compromises ($4.73M), and stolen or compromised credentials ($4.50M) (IBM 2025).
Phishing remains the most common entry point, appearing in a significant share of breaches (IBM 2025). Ransomware/extortion breaches cost $5.08M on average and appear in 44% of all breaches (Verizon DBIR 2025). Supply chain attacks are accelerating: third-party breaches doubled year-over-year to 30% (IBM 2025), reflecting attackers' increasing focus on exploiting trusted vendor relationships.
| Finding | Value | Source |
|---|---|---|
| Breaches involving human element | 68% | Verizon DBIR 2025 |
| Breaches caused by human error | 88% | Stanford University |
| Breach cost from stolen credentials | $4.81M | IBM Cost of a Data Breach Report 2025 |
| Phishing as initial attack vector | 16% | IBM Cost of a Data Breach Report 2025 |
| Ransomware/extortion breach cost | $5.08M | IBM Cost of a Data Breach Report 2025 |
| Supply chain compromise cost | $4.91M | IBM Cost of a Data Breach Report 2025 |
| Breaches involving third parties | 30% | IBM Cost of a Data Breach Report 2025 |
| Breaches caused by external actors | 70% | Verizon DBIR 2025 |
| Exploited vulnerability breach cost | $4.24M | IBM Cost of a Data Breach Report 2025 |
| Malicious insider breach cost | $4.92M | IBM Cost of a Data Breach Report 2025 |
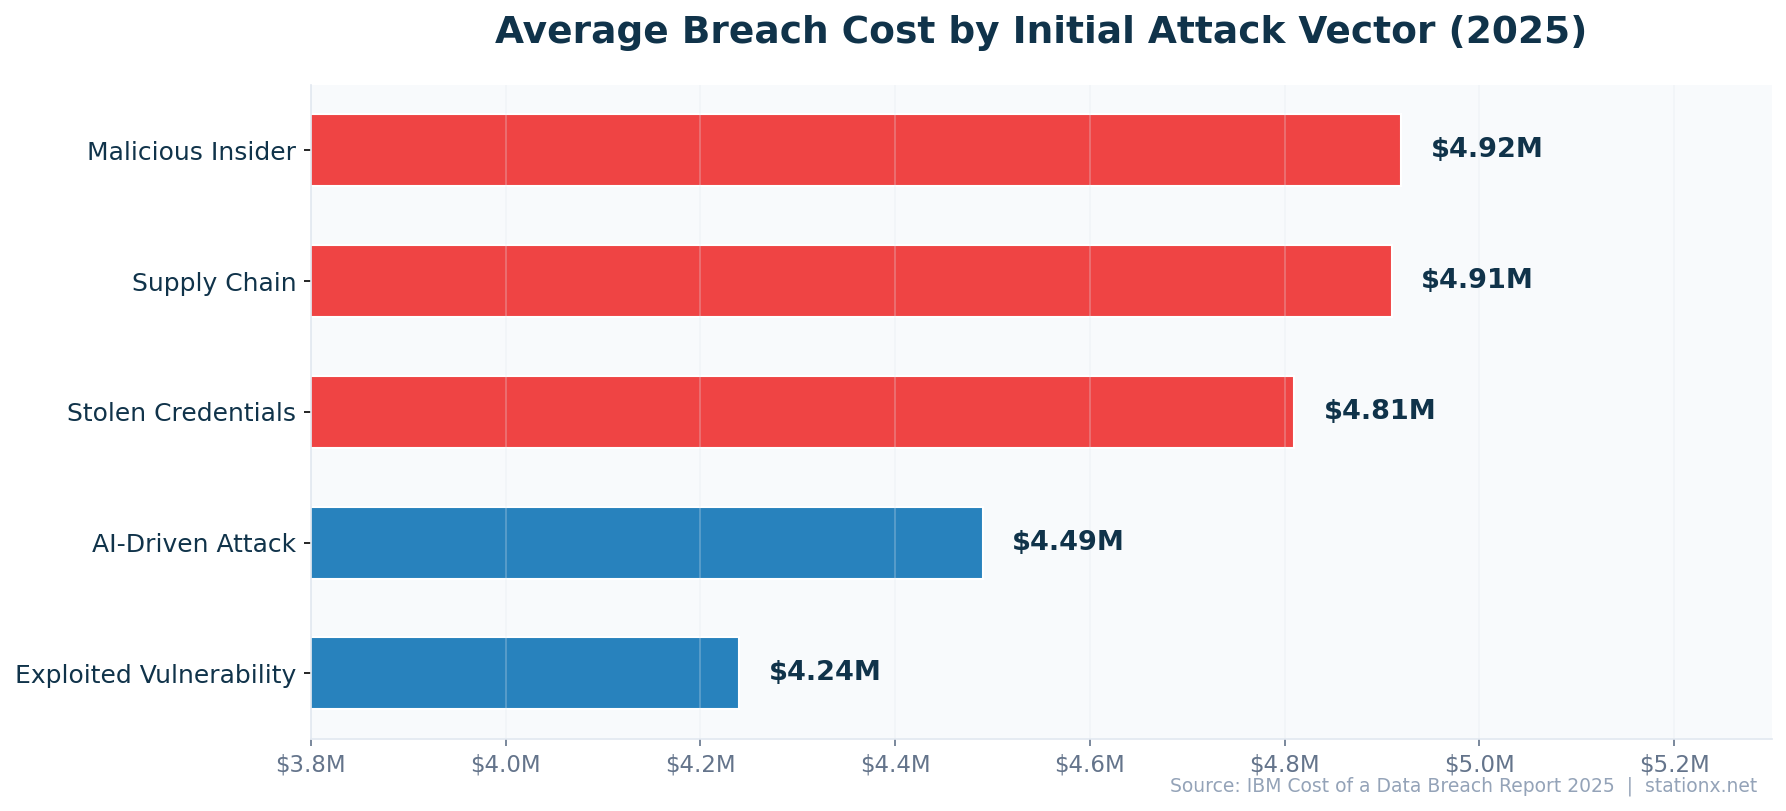
Most Costly Attack Vectors
- Malicious insider: $4.92M
- Supply chain: $4.73M
- Ransomware/extortion: $5.08M
Most Common Attack Vectors
- Phishing: most frequent entry
- Stolen credentials: most persistent
- Human error: 88% of all breaches
Nathan House's Analysis: Third-Party Breaches Are the Fastest-Growing Vector
Third-party breaches doubled to 30% of all incidents (IBM 2025). Cross-referencing with CrowdStrike and Mandiant data, supply chain attacks are increasingly sophisticated — targeting managed service providers, SaaS platforms, and software update mechanisms. The SolarWinds and MOVEit breaches demonstrated this at scale. Organizations focused solely on perimeter security miss the largest growing threat: their own supply chain.
Stolen Credentials — The Persistent Threat
Stolen or compromised credentials remain among the costliest attack vectors at $4.50M per breach (IBM 2025). CrowdStrike reports that 79% of attacks are now malware-free, relying instead on valid credentials to move laterally through networks. This shift from malware-based to identity-based attacks makes traditional endpoint detection insufficient. Organizations need identity threat detection and response (ITDR) capabilities alongside traditional EDR.
Credential-based breaches also take longer to detect. IBM data shows the average time to identify a breach involving stolen credentials exceeds the 181-day average for other vectors. The longer dwell time compounds costs as attackers access more systems and exfiltrate more data. Multi-factor authentication, privileged access management, and credential monitoring services are the most effective countermeasures.
Malicious Insiders — The Costliest Per Breach
Malicious insider attacks cost $4.92M per breach — the highest of any initial attack vector in IBM's dataset. While less frequent than phishing or stolen credentials, insider attacks are harder to detect and contain. They exploit legitimate access privileges, bypassing most perimeter-focused security controls. Organizations with mature insider threat programs that combine user behaviour analytics, data loss prevention, and zero-trust architectures see significantly lower costs.
Nathan House's Analysis: The Cost-Frequency Paradox
The most costly vectors (insiders at $4.92M, supply chain at $4.73M) are not the most common. The most common vector (phishing) is among the cheapest to remediate individually. This creates a paradox for security budgets: do you invest in preventing the most likely attacks or the most expensive ones? Cross-referencing IBM and Verizon data, the answer is both — phishing prevention reduces frequency while insider threat programs reduce maximum damage. The optimal strategy addresses the full distribution curve, not just the average.
⏱️ Breach Detection & Response Times
The average data breach takes 241 days from identification to containment — 181 days to detect and 60 days to contain (IBM 2025). That is nearly 8 months of attacker dwell time. Each day matters financially: breaches contained in under 200 days cost $1.14M less than those taking longer.
AI and automation are the biggest factor in reducing both time and cost. Organizations with extensive AI/automation pay $3.62M per breach compared to $5.52M without — a $1.9M gap (IBM 2025). AI-equipped teams detect breaches 51 days faster, cutting detection time from 232 to 181 days. The cost reduction from AI deployment (34%) exceeds the savings from any other single factor IBM measured.
| Finding | Value | Source |
|---|---|---|
| Average breach lifecycle (identify + contain) | 241 days | IBM Cost of a Data Breach Report 2025 |
| Average time to identify a breach | 181 days | IBM Cost of a Data Breach Report 2025 |
| Average days to contain a breach | 60 days | IBM Cost of a Data Breach Report 2025 |
| Breach cost when lifecycle > 200 days | $5.01M | IBM Cost of a Data Breach Report 2025 |
| Breach cost with fast resolution (< 200 days) | $3.87M | IBM Cost of a Data Breach Report 2025 |
| Cost savings from security AI/automation | $1.9M | IBM Cost of a Data Breach Report 2025 |
| Breach cost reduction from security AI | 34% | IBM Cost of a Data Breach Report 2025 |
| Breach cost without AI/automation | $5.52M | IBM Cost of a Data Breach Report 2025 |
| Breach cost with extensive AI/automation | $3.62M | IBM Cost of a Data Breach Report 2025 |
Nathan House's Analysis: The ${costPerDay}/Day Cost of Delay
At $4.44M over 241 days, each day of breach lifecycle costs approximately $18,423,237. Organizations that detect breaches within 200 days save an average of $1.14M. The implication is clear: investing in detection speed (SIEM, XDR, AI-powered SOC) has a direct, measurable ROI. Every 30 days cut from detection time saves roughly $552,697,110 in breach costs.
What Would a Breach Cost Your Organisation?
Adjust the inputs below to estimate your breach cost based on IBM Cost of a Data Breach 2025 data.
The 200-Day Threshold
IBM identifies 200 days as the critical threshold for breach lifecycle cost. Breaches identified and contained within 200 days cost substantially less than those exceeding this window. The 200-day mark is not arbitrary — it approximately aligns with the point where attackers have typically established persistence, moved laterally, and begun data exfiltration at scale. Catching a breach in the initial access or lateral movement phase prevents the most costly outcomes.
Organizations should target three detection milestones: initial compromise detection within 72 hours (prevents establishment of persistence), lateral movement detection within 30 days (prevents access expansion), and data exfiltration detection within 90 days (prevents mass data loss). Each milestone corresponds to a different technology layer: EDR for initial access, NDR for lateral movement, and DLP for exfiltration.
Nathan House's Analysis: AI Detection — The Single Largest Cost Differentiator
No other single factor in IBM's study produces a comparable cost reduction to AI/automation. The $1.90M gap between AI-equipped ($3.62M) and AI-deficient ($5.52M) organizations exceeds the savings from incident response planning, DevSecOps, employee training, or any other individual control. This isn't about replacing analysts — it's about giving them faster signal-to-noise ratios. The 51-day detection speed improvement translates to catching attackers during lateral movement rather than after data exfiltration.
🏥 Data Breach Cost by Industry
Healthcare has topped the breach cost rankings for 15 consecutive years at $11.2M per breach — 2.5x the global average (IBM 2025). This reflects HIPAA penalties, patient notification requirements, and the high value of medical records on dark web markets. Financial services ($6.08M) ranks second, facing 300x more attacks than other industries. Critical infrastructure ($4.82M) faces rising IoT-related threats, up 107% year-over-year.
Government ($2.83M) and education ($3.80M) face lower average costs but high attack volumes. Education experienced a record year in 2026 with 252 reported incidents. Government agencies face a unique challenge: 98% encryption rate in ransomware attacks targeting the sector, meaning nearly all successful ransomware deployments result in data being locked.
| Finding | Value | Source |
|---|---|---|
| Healthcare average breach cost | $11.2M | IBM Cost of a Data Breach Report 2025 |
| Financial services average breach cost | $6.08M | IBM Cost of a Data Breach Report 2025 |
| Critical infrastructure breach cost | $4.82M | IBM Cost of a Data Breach Report 2025 |
| Government sector breach cost | $2.83M | IBM Cost of a Data Breach Report 2025 |
| Education sector breach cost | $3.80M | IBM Cost of a Data Breach Report 2025 |
| Global average breach cost | $4.44M | IBM Cost of a Data Breach Report 2025 |
Healthcare — $11.2M (15 Consecutive Years at #1)
Healthcare's dominance in breach costs is structural, not cyclical. Three factors create an elevated cost floor: HIPAA violation penalties (up to $2.1M per violation category per year), mandatory patient notification requirements (often requiring individual notification for millions of patients), and the high dark-web value of medical records ($250+ per record vs $5-10 for credit card data). Medical record breaches also trigger downstream identity theft that creates years of follow-up cost.
The sector also faces unique operational costs during breaches. When hospital systems go offline from ransomware, patient care suffers — surgeries are delayed, emergency departments divert patients, and clinicians resort to paper records. These operational disruptions create costs that don't exist in retail or financial breaches. The Change Healthcare breach in 2024 demonstrated this at scale, disrupting pharmacy operations for weeks and costing an estimated $2.87 billion in total impact.
Financial Services — $6.08M (300x Attack Volume)
Financial institutions face 300x more cyberattacks than other industries, driven by the direct financial payoff of successful breaches. Bank fraud, wire transfer compromise, and trading system manipulation create immediate monetary losses on top of the standard breach costs. Regulatory penalties from banking regulators (OCC, FCA, BaFin) add another layer of expense. Despite heavy security investment, the sheer volume of attacks means some inevitably succeed.
Nathan House's Analysis: Healthcare — 15 Years at #1 and No End in Sight
Healthcare's $11.2M average breach cost is 2.5x the global average. Three factors keep healthcare at the top: (1) HIPAA violation penalties can reach $2.1M per violation category, (2) medical records sell for $250+ on dark web markets vs $5-10 for credit card data, and (3) patient care disruptions during breach response create operational costs that don't exist in other sectors. No amount of AI automation eliminates the regulatory penalty structure.
Costliest Industries
- Healthcare: $11.2M per breach
- Financial Services: $6.08M per breach
- Critical Infrastructure: $4.82M per breach
Lower-Cost Industries
- Education: $3.80M per breach
- Government: $2.83M per breach
- Global Average: $4.44M per breach
📉 Data Breach Trends & Emerging Threats
Several trends are reshaping the breach landscape. Ransomware is now present in 44% of all breaches, up from 32% the prior year (Verizon DBIR 2025). Supply chain attacks doubled to 30% of incidents (IBM 2025). AI is a double-edged sword: shadow AI (unauthorized AI tools used by employees) contributed to breaches at a growing rate, adding extra costs per incident. But AI-powered security tools reduced breach costs by 34%.
The human element persists at 68% of breaches, despite billions spent on security awareness training. Phishing remains the top entry vector, but AI-generated phishing emails now achieve higher click rates than human-crafted ones (HBR). The rise of identity-based attacks and malware-free intrusions (79% of CrowdStrike detections) signals a shift from perimeter defense to identity security as the primary battleground.
| Finding | Value | Source |
|---|---|---|
| Ransomware in breaches (2025) | 44% | Verizon DBIR 2025 |
| Third-party breaches (doubled YoY) | 30% | IBM Cost of a Data Breach Report 2025 |
| AI/automation savings per breach | $1.9M | IBM Cost of a Data Breach Report 2025 |
| Breaches involving shadow AI | 20% | IBM Cost of a Data Breach Report 2025 |
| Extra breach cost from shadow AI | $670K | IBM Cost of a Data Breach Report 2025 |
| Human element in breaches | 68% | Verizon DBIR 2025 |
Nathan House's Analysis: Three Converging Trends
Three trends are converging to create a more dangerous breach landscape in ${currentYear}: (1) ransomware is commoditizing through Ransomware-as-a-Service, making sophisticated attacks accessible to low-skill threat actors, (2) supply chain attacks are scaling, giving attackers one-to-many access through trusted vendor relationships, and (3) shadow AI is creating new data exposure surfaces that traditional security tools don't monitor. Organizations that address all three — endpoint, supply chain, and AI governance — will see the biggest cost reductions.
Shadow AI — The Newest Breach Vector
Shadow AI — unauthorized use of AI tools by employees — is creating new data exposure surfaces. IBM reports that breaches involving shadow AI incur additional costs beyond the standard average, driven by data leakage through AI chatbots, code assistants, and third-party AI APIs. Employees paste sensitive data into AI tools without understanding the data handling implications. Many organizations lack AI governance frameworks: IBM found a significant percentage have no AI upload controls in place.
The shadow AI risk is compounded by the difficulty of detection. Unlike shadow IT (unauthorized software), shadow AI usage often occurs through web browsers or approved applications with AI features. Traditional DLP and CASB tools may not flag data pasted into AI chat interfaces. Organizations need specific AI usage policies, browser-level controls, and AI-aware DLP rules to address this emerging vector.
Ransomware — From 32% to 44% of All Breaches
The single largest tactical shift in the 2026 breach landscape is the surge of ransomware, now present in 44% of all breaches, up from 32% the prior year (Verizon DBIR 2025). Ransomware-as-a-Service has lowered the barrier to entry, enabling less-skilled threat actors to launch sophisticated attacks. Ransomware/extortion breaches cost $5.08M on average (IBM 2025), well above the $4.44M global average.
The economic dynamics are shifting too. 64% of organizations now refuse to pay ransom (Verizon DBIR 2025), up from previous years, partly driven by regulatory pressure and partly by improved backup capabilities. However, attackers have adapted with double and triple extortion tactics: encrypting data, threatening to publish it, and contacting affected customers directly. The median ransom demand is $1.32M, but median payment is just $115K (Verizon/Sophos), suggesting effective negotiation by victims who do pay.
Nathan House's Analysis: The Ransomware Payment Paradox
64% of victims now refuse to pay, yet ransomware attacks are at an all-time high (44% of breaches). This seems contradictory — if fewer organizations pay, why do attackers persist? The answer is volume economics. Even if only 36% of victims pay, at $115K median payment across 15 victims per day, the revenue is substantial. Ransomware gangs have shifted from targeting individual large payments to high-volume, lower-payment attacks. The strategy works because the cost of launching attacks (via RaaS) has dropped while the addressable market (internet-connected organizations) keeps growing.
🤖 AI & Breach Prevention: What Works
IBM's 2026 data makes the case for AI-powered security unambiguously. Organizations with extensive AI/automation pay $3.62M per breach versus $5.52M without — a 34% reduction and the largest cost differentiator in the entire study. AI-equipped security teams detect breaches 51 days faster, giving attackers less time to move laterally and exfiltrate data.
But AI cuts both ways. Shadow AI creates new breach vectors (IBM reports growing breaches involving unauthorized AI use). AI-generated phishing emails achieve higher click rates than human-crafted ones (HBR). AI-powered deepfake scams are targeting executives for wire transfer fraud (CrowdStrike reports a $25M deepfake CFO scam). The security industry is in an AI arms race where both attackers and defenders are upgrading simultaneously.
Prevention Controls That Reduce Breach Costs
Beyond AI/automation, IBM identifies several controls that significantly reduce breach costs. Incident response planning and testing reduces costs by enabling faster, more coordinated responses. Employee training reduces the 68% human element factor. DevSecOps practices catch vulnerabilities before deployment. Encryption protects data even after exfiltration, reducing notification costs and regulatory penalties.
The most effective strategy combines multiple controls. Organizations that deploy AI/automation alongside incident response planning, employee training, and zero-trust architectures achieve the lowest total breach costs. No single control is sufficient — the threat landscape is too diverse. However, AI/automation consistently shows the highest individual ROI, making it the priority investment for organizations that can only fund one major initiative.
Nathan House's Analysis: The AI Security Investment Hierarchy
If your organization can fund only one security investment in ${currentYear}, the data points to AI-powered detection and response (XDR with AI, AI-augmented SIEM, automated incident response). The $1.9M per-breach savings pays for itself after a single incident. After AI, prioritize: (1) incident response planning and tabletop exercises, (2) identity security (MFA everywhere, PAM, ITDR), (3) supply chain risk management. This hierarchy is derived from IBM's cost impact analysis across 604 organizations.
Zero Trust Architecture — Beyond the Buzzword
Zero trust architectures reduce breach costs by limiting lateral movement after initial compromise. Instead of relying on perimeter security (which fails 65% of the time through credential-based attacks), zero trust verifies every access request regardless of source. IBM data shows organizations with mature zero trust implementations experience lower average breach costs and shorter breach lifecycles.
The practical challenge is implementation. Full zero trust deployment takes 2-3 years for large enterprises. Organizations should prioritize: (1) MFA on all external-facing systems, (2) network microsegmentation for critical data, (3) continuous authentication for privileged users. Each step reduces breach cost incrementally, and partial zero trust implementation still outperforms no zero trust at all.
The 79% Malware-Free Problem
CrowdStrike reports 79% of attacks are now malware-free — they use valid credentials, living-off-the-land techniques, and legitimate tools. Traditional antivirus and endpoint detection miss these entirely. This is why identity security (credential monitoring, impossible travel detection, user behaviour analytics) has become the new frontline. Organizations still relying primarily on signature-based detection are defending against last decade's threat landscape.
🏆 Notable Breach Records & Milestones
The breach landscape includes several superlatives that put the statistics in context. The US has held the #1 position in IBM's breach cost rankings for 15 consecutive years. Healthcare has been the costliest industry for 15 consecutive years. The FBI IC3's $16.6 billion in reported losses for 2024 represents a 33% single-year increase — the steepest jump in recent history.
In terms of individual incidents, the Change Healthcare breach (2024) stands as one of the most expensive in history, with estimated costs exceeding $2.87 billion including operational disruption, remediation, and regulatory response. The MOVEit file transfer vulnerability (2023-2024) affected over 2,600 organizations and 77 million individuals through a single supply chain vulnerability, demonstrating the multiplier effect of third-party breaches.
The Largest Known Breach Costs
While IBM measures average costs, individual mega-breaches can far exceed these averages. The Equifax breach (2017) cost approximately $1.4 billion including the $700M settlement. The Marriott breach (2018) cost an estimated $200M. Capital One (2019) paid $190M in settlements. These outlier events demonstrate that average statistics understate tail risk — the worst-case scenario for any organization is not $4.44M but potentially billions.
The pattern in mega-breaches is consistent: they typically involve long dwell times (Equifax: 78 days, Marriott: 4 years), credential compromise or vulnerability exploitation as the entry vector, and regulatory penalties that exceed the direct response costs. The lesson for risk quantification: build your threat model around the 95th percentile, not the average.
Nathan House's Analysis: Tail Risk — What the Average Doesn't Tell You
IBM's $4.44M average is useful for benchmarking but dangerous for budgeting. The distribution of breach costs follows a power law: most breaches cost well under $4.44M, but a small number cost billions. When building a business case for security investment, use the average for ROI calculations but the tail (95th percentile) for risk quantification. Your board needs to understand both: the likely cost ($2-3M for most organizations) and the worst case ($100M+ for regulated enterprises with customer data). The difference determines whether you self-insure or buy cyber insurance.
Industry Risk Profile
Select an industry to see its cybersecurity risk profile.
✅ Key Takeaways
What Security Leaders Should Know
- AI/automation is the highest-ROI security investment. $1.9M saved per breach, 34% cost reduction, 51 days faster detection. No other single factor delivers comparable savings (IBM 2025).
- Supply chain is the fastest-growing threat vector. Third-party breaches doubled to 30% (IBM 2025). Vendor risk management and SBOM adoption are no longer optional.
- Speed of detection directly reduces cost. Breaches contained in under 200 days cost $1.14M less. Every 30 days cut from lifecycle saves real money.
- Country and industry matter more than you think. US healthcare faces $11.2M per breach while Brazil faces $1.22M. Benchmark against your peer group, not the global average.
- The human element is still the largest attack surface. 68% of breaches involve human error, social engineering, or credential misuse (Verizon DBIR 2025). Training and identity security remain essential.
How to Use This Data
Security professionals can use these statistics to build business cases for cybersecurity investment, benchmark their organization's risk profile against industry and country averages, and justify budget requests with hard data. Use the country rankings and industry comparisons to highlight cost differentials relevant to your organization.
This page is updated monthly as new reports are published. Bookmark it and return for the latest data. If you spot an outdated statistic or want to suggest a source, contact us.
❓ Frequently Asked Questions
What is the average cost of a data breach?
The global average cost of a data breach is $4.44 million in 2026, down 9% from $4.88 million in 2024 (IBM Cost of a Data Breach Report 2025). The US average is significantly higher at $10.22 million, the highest of any country.
Which country has the highest data breach costs?
The United States has the highest average data breach cost at $10.22 million, followed by the Middle East ($7.29M) and Benelux ($6.24M). The US has topped IBM's country rankings for 15 consecutive years, driven by higher regulatory penalties, litigation costs, and notification requirements.
How long does it take to detect a data breach?
The average breach lifecycle is 241 days — 181 days to identify and 60 days to contain (IBM 2025). Organizations with AI/automation detect breaches 51 days faster. Breaches contained in under 200 days cost significantly less than those taking longer.
What is the most common cause of data breaches?
Human error and social engineering are the leading causes. 68% of breaches involve a human element (Verizon DBIR 2025), and 88% are attributed to human error broadly (Stanford). Stolen credentials, phishing, and ransomware are the costliest initial attack vectors (IBM 2025).
How many data breaches happen each year?
The US recorded a record 3,322 data breaches in 2024 (ITRC/Barracuda). Globally, a cyberattack occurs approximately every 39 seconds. FBI IC3 received 880,418 complaints in 2024, resulting in $16.6 billion in reported losses.
Which industry is most affected by data breaches?
Healthcare is the most expensive industry for data breaches at $11.2 million per incident — 2.5x the global average — and has held the top position for 15 consecutive years (IBM 2025). Financial services ($6.08M) and critical infrastructure ($4.82M) follow.
About This Data
This article draws from 140 statistics aggregated from 50+ authoritative sources including IBM Cost of a Data Breach, Verizon DBIR, CrowdStrike Global Threat Report, WEF Global Cybersecurity Outlook, FBI IC3, ISC2 Cybersecurity Workforce Study, Sophos, Gartner, Mandiant M-Trends, and Ponemon Institute reports.
Derived statistics (marked "Nathan House's Analysis") are computed by cross-referencing data from multiple sources — for example, comparing breach costs across industries using IBM data, or validating ransomware trends across Verizon, Sophos, and HIPAA Journal findings.
All statistics include inline source citations with links to primary sources. Data spans 2023-2026, with preference given to the most recent available figures. Last updated: June 2026.
About the Author

Nathan House, Founder & CEO of StationX
Nathan House has 30 years of hands-on cybersecurity experience and is Cambridge-educated, holding CISSP, CISA, CISM, OSCP, CEH, and SABSA. He founded StationX in 1999 — one of the UK’s first cybersecurity companies — and has secured £71 billion in UK mobile banking transactions and the London 2012 Olympics, advising clients including Microsoft, Cisco, BP, Vodafone, and VISA. He authored the world’s most popular cybersecurity course — a #1 Udemy bestseller taken by over 500,000 students — and was named Cyber Security Educator of the Year 2020, AI Security Educator of the Year, and a UK Top 25 Security Influencer 2025. A DEF CON speaker and featured expert on CNN, Fox News, NBC, and the BBC, Nathan leads StationX’s training of more than half a million students worldwide.